|

|
Log Visualizer is a command line utility that is designed as auxiliary application for HostMonitor.
Professional and Enterprise licenses for Advanced Host Monitor already include a license for Log Visualizer.
Holders of a Starter or Professional licenses may purchase an additional license for Log Visualizer separately. |
 Intro
Usage
Setup profiles
System Requirements
Price Intro
Usage
Setup profiles
System Requirements
Price
HostMonitor may store tests results in log files (DBF, HTML, Text), also it may use user-specified database to keep history of test results.
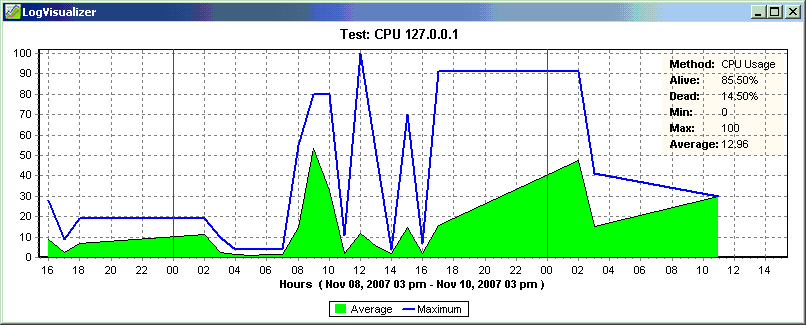
The purpose of Log Visualizer is to visualize test results for certain test item on demand.
The application parses content of a log file and presents test results over period of time as a variety of charts.
What is the difference between Log Visualizer and Log Analyzer?
- Log Analyzer provides information about all test items that are listed in the log; it creates reports for set of tests. Log Visualizer creates chart for specific test item.
- Log Analyzer can be used as GUI application and as command line utility while Log Visualizer is command line utility; it is designed to be started by HostMonitor or your own homemade script (nevertheless it provides some simple GUI as well).
- When you need a chart for single test, it's much better to use Log Visualizer because it is optimized for such tasks.
Log Visualizer uses specially formatted files (repository) to store intermediate data grouped by test items on hourly, daily, weekly and monthly basis.
That trick helps application to increase productivity and execution speed significantly.
When you need report with charts for a large amount of test items, Log Analyzer might be preferable.
Log Visualizer creates chart that shows test results over specified period of time (day, week, month, etc). Depending on command line parameters chart can be stored in specified file (GIF format) or the same chart can be displayed on screen.
Using Log Visualizer you may:
- compose your own documents with the charts created by Log Visualizer on regular basis; e.g. you may create HTML template with links to images and use scheduler to launch Log Visualizer to update the images on regular basis (e.g. every midnight)
- create shortcuts on your desktop for specific test items; then you may bring up chart for the test with easy point-and-click operation;
- also, if you have Log Visualizer installed, HostMonitor will provide additional option thru Test Info dialog window. HostMonitor will display button that allows you to bring up chart for the test item
Log Visualizer may utilize all types of log files: HTML, Text, and DBF log files.
It is also able to utilize the log records, stored in various databases using ODBC interface.
Usage and input parameters
When you use HostMonitor to start Log Visualizer, HostMonitor checks logvisualizer.ini file, adjusts parameters (e.g. ODBC data source parameters) and utilizes necessary command line switches to start utility in maintenance-free mode.
So you just should click a button to see the chart for specified test item.
When you start Log Visualizer manually or you need to create your own script to launch the utility, use the following command line syntax:
logvisualizer.exe -testid:<testID> -logprofile:<profile_name> [-inputfile:<log_filename>] [-outputimage:<image_filename>]
[-period:<chart_period>] [-daysback:<number_of_days> | -starttime:<mm/dd/yyyy>]
[-setmax:<upper_limit>] [-setunits<unit_specificator>]
First 2 parameters are obligatory:
| -testid | testID - ID of the test that should be analyzed and visualized. You may use HostMonitor's Test Info dialog to find out ID of some specific test item.
If you need to know ID for all test items, you may use
Custom HTML report with %TestID%
macro variable in the template. |
| -logprofile | profile_name - name of the file that contains application settings.
See Setup profiles section for details.
You may specify filename without path when profile is located in current directory (e.g. -logprofile:logvisualizer.ini), otherwise you should provide path to the file (e.g. "-logprofile:c:\program files\hostmon\lv2.ini") |
Other parameters are optional: |
| -inputfile | log_filename - HostMonitor's log file (HTML, TXT or DBF). When inputfile is not specified, Log Visualizer will check ODBC log setting. If ODBC log is specified, it will be used for analyzing. |
| -outputimage | image_filename - name of the GIF file. If this parameter is specified, Log Visualizer will create GIF file with image of the chart. Application will not display anything on screen. |
| -period | chart_period parameter specifies length of time frame that should be displayed and precision of the chart. There are several visualization levels available:
- DayByHours - a chart on hourly basis based on last 48 hours
- WeekByHours - a chart on hourly basis based on 1 week of data
- WeekbyDays - a chart on daily basis based on 1 week of data
- MonthByDays - a chart on daily basis based on 1 month of data
- MonthByWeeks - a chart on weekly basis based on 1 month of data
- YearByWeeks - a chart on weekly basis based on 1 year of data
- YearByMonths - a chart on monthly basis based on 1 year of data
|
| -daysback |
This parameter allows you to shift time interval used for the chart by certain number of days. By default, daysback is set to 0.
This means chart bounds are calculated relatively to current date. If you set daysback to 1, charts bounds will be calculated from yesterday, and so on.
Note: you also may specify negative values for daysback parameter. Unlike positive values, that just shift chart bounds back in time, negative values have predefined meanings that depend on chart period parameter.
There is a list of special values:
If chart period is set to WeekByHours or WeekByDays, you may use the following numbers for daysback parameter
-3 the beginning of the chart will be aligned to the first day of the current week
-4 the beginning of the chart will be aligned to the first day of the previous week
-10 two weeks shift, aligned to the first day of the week
-11 three weeks shift, aligned to the first day of the week
If chart period is set to MonthByDays or MonthsByWeeks, you may set daysback parameter to using the following values:
-5 the initial chart bound will be aligned to the first day of this month
-6 the initial chart bound will be aligned to the first day of the previous month
-9 two months shift, aligned to the first day of the month
If chart period is set to YearByWeeks or YearByMonths, you may use the following numbers for daysback parameter
-7 the left chart bound will be aligned to the first day of this year
-8 the left chart bound will be aligned to the first day of the last year |
| -starttime |
Sometimes you may need to visualize logging data for specific period of time instead of showing test results for the last day/week/month.
In such case you may use -starttime:mm/dd/yyyy command line parameter instead of -daysback parameter. |
| -setmax |
<upper_limit> specifies the upper limit of the vertical axis. You may use this parameter to display the "Reply" values of the test with a different scale.
E.g. for CPU Usage tests you may use -setmax:100 option to set axis of ordinates to 100(%).
<upper_limit> can be specified as an integer number or a number and special suffix: Kbit, Mbit, Gbit, KB, MB, GB.
Please conclude parameter in quotes when you are using suffix E.g. "-setmax:50 MB".
Note: if some test results are greater than specified limit, Log Visualizer will adjust limit so all tests results will be visible. |
| -setunits | You may use one of the following units for "setunits" parameter:
- KB
- MB
- GB
- TB
- Kbit
- Mbit
- GBit |
Several examples of command line that starts Log Visualizer:
logvisualizer -testid:1520 -logprofile:C:\HM\lv_profile.ini "-setmax:500 Gb" -setunits:MB
logvisualizer -testid:1520 -logprofile:C:\HM\lv_profile.ini -inputfile:C:\HM\Logs\log.htm
logvisualizer -testid:1520 -logprofile:C:\HM\lv_profile.ini -period:MonthByDays -outputimage:C:\HM\Images\daily_115645.gif
logvisualizer -testid:1520 -logprofile:C:\HM\lv_profile.ini -daysback:30 -outputimage:C:\HM\Images\daily_115645.gif
logvisualizer -testid:1520 -logprofile:C:\HM\lv_profile.ini -starttime:01/15/2009
Batch mode
If you setup HostMonitor to change log file on regular basis (weekly, monthly, etc) and you have not used Log Visualizer for a while, you may need to start application in batch mode using the following command line:
logvisualizer.exe -batch_mode -logprofile:<profile_name> -inputfile:<log_filename> [-clear_repository]
| -batch_mode | This parameter tells application to analyze specified log file (see -inputfile parameter) and update repository without displaying GUI and without creating GIF image for a test item |
| -logprofile | profile_name - name of the file that contains application settings. See
Setup profiles section for details. You may specify filename without path when profile is located in current directory (e.g. -logprofile:logvisualizer.ini),
otherwise you should provide path to the file (e.g. "-logprofile:c:\program files\hostmon\lv2.ini") |
| -inputfile | log_filename - HostMonitor's log file (HTML, TXT or DBF) |
| -clear_repository | When this optional parameter specified, Log Visualizer removes all records from repository before processing log file |
Batch mode allows you to analyze several log files one by one and create up-to-date repository without spending time for manual setup.
For example, if you setup HostMonitor using "Automatically change the log every month" option, HostMonitor creates 12 files during each year: 012007-log.htm, 022007-log.htm,
032007-log.htm, ..., 122007-log.htm. Then you may create simple BAT file to analyze all log files for 2007:
for /L %i in (1,1,9) do logvisualizer.exe -batch_mode -logprofile:logvisualizer.ini "-inputfile:c:\hostmon7\logs\0%i2007-log.htm"
for /L %i in (10,1,12) do logvisualizer.exe -batch_mode -logprofile:logvisualizer.ini "-inputfile:c:\hostmon7\logs\%i2007-log.htm"
Note: you should analyze log files in proper order, i.e. April log file should be analyzer before May log file.
Setup profiles
To setup profile use the following command line
logvisualizer.exe -setupprofile:<profile_name>
-setupprofile parameter tells application to load specified profile (specially formatted text file) and bring-up "Profile setting" dialog window.
You may specify filename without path when profile is located in current directory (e.g. -setupprofile:logvisualizer.ini),
otherwise you should provide path to the file (e.g. "-setupprofile:c:\hostmon\lv2.ini").
Note #1: if you specify non-existing file, application may create new file after user's confirmation.
Note #2: HostMonitor may modify logvisualizer.ini file. If you plan to use Log Visualizer with your own scripts, we recommend creating another profile for your needs.
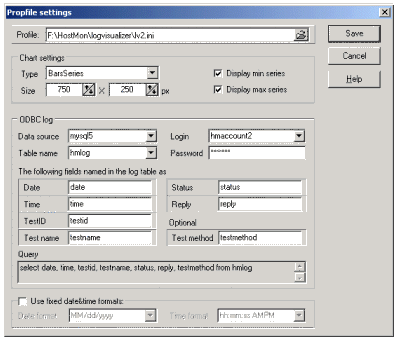
You may use "Profile settings" dialog window to setup several profiles.
Different profiles may describe different ODBC logs and various chart setting. This way you may easily generate various kinds of charts.
Chart settings
Type
This option allows you to select type of the chart. There are four chart types available: Area series, Bar series, Line series, Point series
Size
This parameter specifies width and height of the chart image
Display min series
Display max series
Chart always shows average results (reply of the test item) for each time interval (hour, day, week, etc).
In addition to average reply Log Visualizer may display minimum and maximum values.
These 2 options allow you to enable such series.
ODBC log
Log Visualizer may analyze log records that are stored in various databases.
Before using such logs you should describe database parameters using "ODBC logs" section of the profile.
For each log you should specify the following parameters:
Data source
Select the data source from drop-down list that displays list of all ODBC data sources installed on your system.
Note: To install or configure Data Source, click Windows Start button, point to Settings, and then click Control Panel.
Double-click Administrative Tools, and then double-click Data Sources (ODBC).
Table name
Provide the name of a table that contains log records
Login/Password
Provide login and password (if required) for database access
Following fields named in the log table as
This option defines actual fields in the table that stores tests results (HostMonitor's ODBC logging could be configured in different ways).
| |
Date / Time
Provide the name of field(s) that stores information about event date and time.
If a single field of the table contains information about date and time, type the same name for both options.
Type of the field could be Date, DateTime, TimeStamp or it can be a text field (which is not recommended).
TestID
Name of the field that stores unique ID of the test. TestID is always unique within an HML file.
Test name
Specify the name of a field that stores the name of the test.
Status
Provide the name of a field with status information.
It could be text field that stores status as a text, e.g. "Host is alive", "No answer", etc. Or it can be numeric field, where number represents certain status:
00- Not Tested
01- Host is Alive
02- No Answer
03- Unknown
04- Not Resolved |
05- Checking
06- Resolving
07- Ok
08- Bad
09- Disabled |
10- Bad Contents
11- WaitForMaster
12- OutOfSchedule
13- Paused
14- Warning
15- Normal |
Reply
Specify the name of a field that stores Reply value of the test. It could be text or numeric field.
Test method
Optionally you may (and we recommend doing this) provide the name of a field that stores information about the test method.
|
Use fixed date&time format
By default Log Visualizer gets current Windows regional settings at startup and uses these parameters to process data/time variables.
You may use this option to define the date & time formats (e.g. DD/MM/YYYY h:mm:ss AMPM).
In this case, Log Visualizer will use the specified formats overriding the system settings.
BTW: Changing the date format does not affect analyzing of the DBF and HTML log files.
Log Visualizer is able to analyze these log files correctly regardless of the date & time settings.
However this option can be useful to analyze text log files or html log files that were created by older versions of HostMonitor.
Minimum system requirements
- Windows XP SP2, Windows 7, 8, 10 or Windows 11
- Windows Server 2003 SP2, Server 2008 SP2/R2, Windows Server 2012, 2016, 2019, 2022
- Internet Explorer 5.5 or higher (application can work without IE, required for help system)
- 2 MB of free disk space
- Minimum screen resolution: 800 x 600
How much does it cost?
When you purchase an Advanced Host Monitor PROFESSIONAL or ENTERPRISE edition you will get the license for Log Visualizer at no cost.
Otherwise the license for Log Analyzer and Log Visualizer costs $45.
You can order Log Visualizer using credit card, Switch and Solo debit cards, check/money order or wire transfer.
Details..
|