|
Preferences |
On this page define the following options:
Font options:
- Windows Font
Choose the font/size for the main window, log viewer and the utilities.
- Terminal window font
Choose the font/size for the Telnet utility.
Tray icon options:
- Icon in system Tray
Hide to tray HostMonitor when it is minimized.
- Animate tray icon when working
The program can animate the tray icon when it is in working mode.
- Change icon when a host dies
HostMonitor will change icon from blue to red when any host changes status to "bad", or change color to
yellow if a test goes to "Unknown" status.
- HostMonitor always Top
HostMonitor will remain in front of all other windows (unless minimized). Application restart required
Autosave options:
-
Do not save test list automatically. If this option is selected, HostMonitor does not save test list
modifications automatically. Saving changes is up to the user (use the "Save" or "Save as" menu items in the
File menu). If changes have been made, the program will remind you to save them before exiting, loading another
TestList, etc.
BTW: HostMonitor will save modification automatically if Windows is shutting down
- Save tests and stats at midnight.
With this option selected HostMonitor will save test settings (if test list was modified) and statistical
information (Alive%, Dead%, Total time and other counters) every midnight. Of course you may save modifications
and statistics manually using menu File -> Save
- Auto save TestList after any changes.
If this option is selected, HostMonitor will automatically save changes every time you add or import new test
items, remove a test, modify, enable or disable items, etc. Also HostMonitor will save test statistics every
30 minutes (HostMonitor does not save statistical information constantly for better performance).
Auto save windows options
When this options is enabled the program will save and restore window parameters (column widths, the size of the panels, etc).
Keep a list of N recent addresses
Instructs HostMonitor to keep a history of recently used addresses.
Store statistics in HML file
This option tells HostMonitor to write all statistical information into a file, so that the statistics build up across multiple
program sessions. If the option is turned off, when an HML file closes down, the statistics pertaining to its tests get reset.
Please note that statistics for any or all of the tests can be nullified at any time using the "Reset ..." menu command.
Store "Recurrences" in HML file
This is an important option, because it is the "Recurrences" field that the program looks at to determine what actions
and when to fire off. Therefore, if the option is deselected, upon closing an HML file or shutting down HostMonitor, the
counter will be reset, so that when the program is restarted, actions will be triggered as tests are first performed.
With the option turned on, recurrence counters will be saved on shutdown, and at the next startup the program will pick up
where it left off, as if the program execution was not interrupted.
Remember current folder
If this option is turned on, HostMonitor will remember current folder and
display it on the next load of the file with tests.
Allow 2 alert profiles for test items
In most cases single alert profile is enough for test item because each alert profile may contain several actions with different
starting conditions, different time restriction options; also you may use "advanced mode" actions.
However in some cases you may reduce number of necessary alert profiles by using 2 alert profiles per test item. If you enable this
option, you will be able to assign 1 or 2 alert profiles for each test item.
|
|
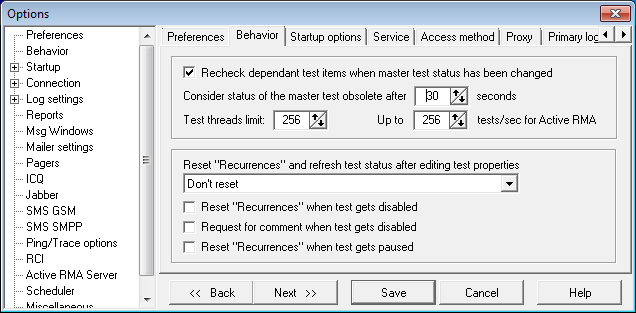
Behavior |
On this page define the following options :
Recheck dependant test items when master test status has been changed
This option tells HostMonitor to recheck all dependant test items immediately
after their master test failure or recovery (otherwise tests will be executed on regular schedule). This helps
to maintain more accurate statistic information.
However HostMonitor does not "touch" dependant items when the master test changes its status to any of the "inactive" statuses (OutOfSchedule, WaitForMaster, Disabled, Paused).
Unless next option is marked as well
Count inactive master test statuses as well
This option tells HostMonitor to change the statuses of all dependant tests when the Master test becomes inactive (OutOfSchedule, WaitForMaster, Disabled, Paused).
Consider status of the master test obsolete after N seconds
This parameter is used by the program to determine whether the Master test status is up-to-date.
Before starting a dependent test HostMonitor checks the status values of the Master tests defined on it.
If Master test was performed more than N seconds ago, HostMonitor will recheck the Master test item before
checking dependant items.
Please note: HostMonitor makes an exception for SNMP Trap test
methods. If such test is used as Master test, its status never considered as obsolete. In other words status
of Master SNMP Trap test will always be considered as up-to-date, regardless of the time when last trap
message was received.
Test threads limit [N]
This option replaced old "Do not start more than [N] tests per second" option. Here you set limit for total number of threads used for test execution
while HostMonitor will decide how many tests can be started at any given moment. Actually its not firm limit, in some cases HostMonitor may start
additional threads (e.g. some tests need a lot of time to provide results).
Up to [N] tests/sec for Active RMA
Sets limit for requests from HostMonitor to ActiveRMA agents
In some cases 20 threads is enough to perform 300 tests per second; in other cases you need 100 threads just for 50 tests/sec (depends on test
methods, test settings, speed of your LAN or internet connection and so on).
After significant changes in test list we recommend to let HostMonitor run for some time (at least 10 minutes) and then use
Auditing Tool to check for possible problems and recommendations (e.g. it may recommend increasing thread limit or limit related
to Active RMA agents).
Reset "Recurrences" and refresh test status after editing test properties?
This option will determine the behavior of the program when the user changes the test parameters
(using Test Properties dialog). You can choose one of the 3 options:
- Always reset "Recurrences" - after modifying test, program will work as the test was just created, the program will perform test and starts alert actions if needed
- Ask confirmation - the program will ask user about action
- Don't reset - the program will not reset any counters
Reset "Recurrences" when test gets disabled
With this option enabled HostMonitor will reset "Recurrences" counter for a test every time when this test become disabled.
"Recurrences" field determines what actions and when to fire off. It means that with this option enabled when test
will be disabled and enabled again, actions will be triggered as tests are first performed.
Request for comment when test gets disabled
With this option enabled HostMonitor will request comment every time operator disables test item(s). However
operator may continue operation without entering any information (keep comment field empty).
Reset "Recurrences" when test gets pause
With this option enabled HostMonitor will reset "Recurrences" counter for a test when operator (or HMS script) pauses test
execution. Note: after Recurrences counter is set to 0, HostMonitor will interpret ANY status assigned to the test by the
next check as "new" status and start actions assigned to the test item.
|
|
Startup |
On this page you can define different options to determine HostMonitor's behavior at startup.
File load mode
This parameter set HML file (file with list of tests) that HostMonitor should use for monitoring
- empty list after load - do not load an HML file
- load file [xxx] - load specified file
- restore last status - reload last used file
Start/Stop mode
Define if program should starts monitoring upon loading or not. There are 3 options:
- start after loading
- stop after loading
- restore last status
Window status
Choose state of HostMonitor's main window:
- minimize after loading - minimize main window after startup.
- maximize after loadng - maximize main window after startup.
- normal size - display window in it's normal size after startup.
- restore last status - restore window's position, size and state that were set at the last closing of the program
Error handler
This parameter defines program's behavior in case error occurs at startup. Choose 1 of 3 options:
- Normal start - show error message (if one occurs) and continue after user confirmation.
- Ignore errors during starting - don't stop and display message.
- Quit if an error occurs - HostMonitor displays message, waits 20 seconds and quits if the user does not press any key to continue.
Also you can override these parameters using command line. See "Command line parameters" section.
Place program in Startup menu
Mark this option to add HostMonitor into Startup group.
Windows Workstation NT/2000, Windows XP, Windows Server 2000/2003 will start HostMonitor upon user logon.
On Windows Vista, Windows Server 2008 and newer systems we recommend to use Windows Task Scheduler instead.
- Please use "Run with highest privileges" option for HostMonitor task.
Also you can install HostMonitor as a service on any system, please refer to
"How to install HostMonitor as Win32 Interactive service" section for more information.
|
|
Service |
HostMonitor uses settings located on this page only when starts as Win32 interactive service
(how to install HostMonitor as a service you can read here).
Log on as
Specify user account (login and password) to impersonate the security context of the user.
When HostMonitor starts as a service, it uses the system account (as all interactive services). But this account
may not have all the necessary permissions, so some tests will not work correctly (UNC test, "disk free space" test
for shared drives, "CPU Usage" test for remote machines, etc). If you need these tests, you will need to assign
a special user account. In this case HostMonitor will impersonate the security context of the user.
Note: Do not change the account using the system utility "Services". If you do so, HostMonitor will not be able to interact with the desktop.
Startup delay
In some cases, initialization of dependent applications and services on the HostMonitor machine may consume a substantial
amount of time. If HostMonitor's tests depend on these applications, false alerts may be generated while they are
initialized.
This setting will cause HostMonitor to wait at least (n) minutes before executing the first monitoring cycle thus
allowing applications and services to start and initialize properly. A setting of "1" (one minute) should be
adequate for most systems.
When service is being stopped
Define HostMonitor's behavior when service is being stopped, choose 1 of 2 options:
- save changes in HML file
- discard all changes
|
|
Access method |
On this page define the method to access the net to retrieve URLs.
Type of access to retrieve pages:
- USE REGISTRY CONFIGURATION
Retrieves the proxy or direct configuration from the registry.
- DIRECT TO NET
Resolves all host names locally.
- VIA NAMED PROXY
Passes requests to the proxy unless a proxy bypass list is supplied and the name to be resolved bypasses the proxy.
- PRECONFIG, PREVENT USING JAVA/SCRIPT/INS
Retrieves the proxy or direct configuration from the registry and prevents the use of a startup JScript or Internet Setup (INS) file.
|
|
Proxy |
Define the following settings if the access method is set to "VIA NAMED PROXY"
Proxy server - address of your proxy server
Proxy port - port number of the proxy server
Use proxy authentication - if your proxy server require authentication you may specify the username and password in these fields.
Proxy bypass list - list of addresses that don't need to be accessed through your proxy server.
This list may include IP addresses, host names, or names of computers from your intranet.
Also, wildcards may be used as well to match domains, host names or addresses.
For example: www.*.com; 128.*; *man*; and so on.
For local addresses use the "<local>" macro.
Use semicolons ";" to separate entries.
|
|
Log settings: Primary log / Backup log |
|
You may specify Primay and Backup common logs, so there are 2 identical sets of parameters located on 2 pages in the Options dialog:
- [Primary log]
- [Backup log]
For each log you may choose defferent log type (ODBC or File),
file format (HTML, Text or DBF) and logging mode (Full, Brief, Midnight or Reply). E.g. you may use Full
logging mode for primary ODBC log managed by your SQL server and use Brief logging mode for backup HTML log
stored on local hard drive.
HostMonitor can switch from primary to backup log when necessary or use both logs at the same time. Also
HostMonitor may execute specified alert profiles when primary or backup logs are not accessible.
First you should decide what type of the log do you need: File or ODBC and choose logging mode that will be used for all test items.
Log type
- None
Choose this option if you are really sure you don't need a log
- File
Record test results into a file stored on local hard driver is a fast and most reliable solution. HostMonitor
supports three different data formats: plain text, HTML and DBF.
- ODBC
Starting with version 3.0, HostMonitor can write log information into database using any ODBC driver
installed on your system (e.g Oracle, MS SQL or MySQL database). It's a very flexible solution - you may
define table structure and choose type of the fields to fit your needs. However you must be sure that ODBC
driver (provided by 3rd party) works reliable and will not cause HostMonitor to crash.
E.g. Microsoft dBase Driver v 4.00 causes resource leakage; Oracle driver v8 may crash application.
Default logging mode
This option tells HostMonitor when information should be written. Choose one of the following options:
- Full: Save information about every performed test
The "Save information about every performed test" option tells HostMonitor to add a record every time a test is
performed.
- Brief: Write a record when test status changes
With this option selected no logging happens as consecutive tests return same status value, until the status
changes, at which point a new log record is added.
- Midnight: Write a record when test status changes + midnight logging
With this option selected HostMonitor records information about current status of all test items at midnight
(every night), then no logging happens as consecutive test probes return same status value, until the status
changes, at which point a new log record is added.
- Reply: Write a record when test status or reply value changes
While the second option (Brief) is obviously most space-efficient, the first one (Full) allows you to build
up statistics on helpful test parameters like response time, reply value, etc.
This statistical information can be then parsed and visualized by the Log Analyzer.
3rd option is useful if you are using Log Analyzer to generate reports for different time intervals but you do
not want to keep large log files.
Please note: you may change logging mode for particular test items in the Test Properties
dialog by choosing one of the options:
- Default - the common settings defined in the Options dialog are used;
- Brief - record information whenever status of the test changes;
- Full - record all test results, regardless of whether their status had changed or not;
- Reply - record information into log every time the status or reply value of the test changes.
File log
If you have chosen "File" as type of the log, then you should define location and name of the common log file.
Select one of the following options:
- Log to specific file
- Automatically change the log every month (MMYYYY-Log.ext)
- Automatically change the log every week (WWYYYY-Log.ext)
- Automatically change the log every day (DDMMYYYY-Log.ext)
If you select option to automatically change the log file date macro variables
may be specified in the log file name. HostMonitor interprets text between the '%' of the log name as
a macro, where 'DD' represents the day of the month, 'WW' - current week number, 'MM'
- the month, 'YY' - the year in two digit format, 'YYYY' - the year.
Log format
Choose format of the log file:
- HTML file
- Text file
- DBF file
"File" logs support three different data formats: plain text, HTML and DBF. Each file format has its own
strengths and weaknesses.
Plain text:
- Text log is the most compact of the three formats (about 80 bytes per record);
- All fields in a text log are delimited with Tab (09), so you can easiliy import the data from a text log into a spreadsheet or a database
HTML:
- HTML logs are more visual;
- HTML logs can be made automatically available over the Web;
- on the flip side, HTML logs take up a lot more disk space (about 800 bytes per record) than text or DBF logs.
DBF:
- DBF logs are relatively compact (173 bytes per record);
- DBF log data is easy to analyze and manipulate, or import into another DBMS
Please note: The date and time formats used internally in DBF files do not depend on the system's
regional setings. Therefore, changing the system date/time formats has no effect on Log Analyzer's ability to
interpret those log elements, which is not the case with the text format. If you choose to keep your log in a
text file, and then change the system date/time format, Log Analyzer may have difficulties calculating test
parameters of the date/type type, like the alive/dead time.
To avoid this problem, turn on the "Use fixed date&time formats" option located on the Miscellaneous
page in the Options dialog. In this case, HostMonitor will use the date&time formats specified,
regardless of the system settings.
Also, If you are running several instances of HostMonitor using different test lists (HML files), please use separate log files as well.
ODBC log
If you have chosen "ODBC" log type, then you should specify data source and SQL query for the logging.
ODBC data source
Choose one of ODBC data sources available on your system.
Note #1: Windows provides system data source names and user data source names (System DSN and User DSN).
User data sources are local to a user and accessible only by the specified user.
If you start HostMonitor as service, it will not be able to use User DSN. So, if you are planning to start
HostMonitor as service and as regular application, select "System DSN" option (that is located on
Misc page in the Options dialog) and choose system ODBC data source for the logging.
In this case HostMonitor will work equally in both modes.
Note #2: you must be sure that ODBC driver (provided by 3rd party) works reliable and will not cause
HostMonitor to crash. E.g.
- Microsoft dBase Driver v 4.00 causes resource leakage;
- Oracle drivers v8 and v10 have many "bugs" and may crash application;
- Old MySQL ODBC drivers v3 cause handles leakage in multithreaded environment;
- MySQL ODBC drivers version 8.00.11 - 8.00.15 may lead to various problems as well, including memory access violations. If you need
to use MySQL ODBC driver version 8.x, please set two options in hostmon.ini file, [Misc] section:
[Misc]
ODBC_UseSharedEnvHandle=1
ODBC_KeepSharedEnvHandle=1
Login
Specify user identifier, if necessary.
Some ODBC drivers (e.g. MS SQL ODBC Driver version 13.1+) support Integrated Windows authentication and Active Directory Integrated
authentication. In this case you may type WindowsAuth instead of login name (for Integrated Windows authentication) or set
ADAuth as login name (for Active Directory Integrated authentication). Password field is not used in such case.
Password
Specify password, if necessary
Timeout
Specify the number of seconds to wait for a login request to complete. If value is 0, the timeout is disabled and
a connection attempt will wait indefinitely.
SQL Query
Here you should specify SQL query to logging test data. Format of the query is up to you; you may use the
macro variables to put in as much detail as you want. For instance, SQL
command might look like this:
INSERT INTO HMLOG (EVENTTIME, TESTNAME, STATUS, REPLY, TESTID, TESTMETHOD, RECURRENCES)
VALUES ('%DateTime%', '%TestName%', '%Status%', '%Reply%', %TestID%, '%TestMethod%', %Recurrences%)
Of course an appropriate database table has to be created before you start using the ODBC logging.
However some parameters are obligatory, especially when you plan to use Log Analyzer.
Database logging table should store the following information:
| Macro variable | Field type | Alternative variable | Alternative type | Meaning |
| %DateTime% | datetime or timestamp | | | time of the event |
| %TestName% | char or varchar | | | name of the test item |
| %TestID% | int | | | unique test ID* |
| %TestMethod% | char or varchar | | | test method** |
| %Status% | char(16) or varchar | %StatusID% | int or tinyint | status of the test |
| %Reply% | char or varchar |
%Reply_CStyle%
%Reply_Number%
%Reply_Integer%
%SuggestedReply% |
char or varchar
decimal or float
int
char or varchar |
reply value*** |
* ID is unique within test list (HML file). If you are running several instances of HostMonitor, test item
from listA may have the same TestID as different item from listB. In such case you may use separate tables
for each instance of HostMonitor or add additional field and use %HM_FILEGUID% variable.
** If you are using descriptive names for your test items, you may skip this field. However its better to
use TestMethod field, unless you need to keep your database as compact as possible.
*** If you don't need very accurate statistics for Traffic Monitor and/or Performance Counter test items, you
may use %Reply_Integer% variable and int data type.
Note #1: Maximum length of the query: 4096 symbols.
Note #2: If you click  button, HostMonitor opens "Expression editor" window for convenient SQL Query editing. button, HostMonitor opens "Expression editor" window for convenient SQL Query editing.
Note #3: If you are using Log Analyzer and you have chosen
"ODBC" as primary log, you should describe database parameters using "ODBC logs Manager"
dialog (that is available thru Log Analyzer menu File -> Setup ODBC logs) and mark
"Use this source as default" option. This allows you to use ODBC logs for "Statistics" feature (HostMonitor: menu Test -> Show statistics).
Alerts
Execute alert profile when log inaccessible
If you mark this option and choose alert profile, HostMonitor will execute
specified actions when it's impossible to record data into the log (e.g. disk is full or SQL server does
not respond).
Note: only "scheduled" actions will be executed,
i.e. a condition to start action should be set to "on the schedule" (in Action Properties dialog).
Execute alert profile when log comes to life
This option tells HostMonitor to execute specified actions when log becomes acessible (e.g. link to SQL
server has been restored).
Note: only "scheduled" actions will be executed,
i.e. a condition to start action should be set to "on the schedule" (in Action Properties dialog).
|
|
Compact Logs |
History-related windows may display performance charts using 2 modes:
- brief (works without log files)
- detailed (requires compact logs)
HostMonitor automatically chooses detailed or brief mode for charts. If you just enabled compact logs, there are no data yet so Brief
mode will be used. After 5-10 minutes HostMonitor may switch to Detailed mode for some time intervals (Today; Last 24 hours). In couple days
HostMonitor may enable Detailed mode for [Yesterday], [Last 48 Hours], [Last 7 days], [Last 14 days] time intervals. And finally Detailed mode
will be enabled for [This month], [Last 30 days], [Last moth], [Last 60 days] intervals.
Note #1: [This year], [Last year], [Last 12 months], [Last 24 months] - only brief mode supported for such time intervals.
Note #2: If you disable compact logs, only brief mode will be used.
| 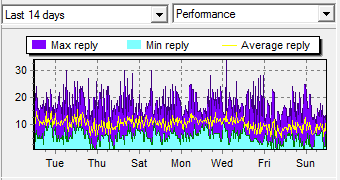 |
| brief mode | detailed mode |
If you are using Brief or Midnight mode for Primary/Backup log files while you need detailed historical charts (Test History, SysInfo,
SuperMatrix, NetMap windows), you may enable Compact logs. HostMonitor will store extra data in specified folder, keep results related
to last 2 months and remove older data.
If you are using Full logging mode for Primary log file, you still may like detailed charts because HostMonitor charts can be displayed
within 1 second while Log Analyzer may need a minute in order to parse large log files.
Disk space requirements
If you set 100,000 test items and HostMonitor performs over 1,000 tests per second, such data files may consume about 10GB of disk space.
If you set just 5,000 test items and perform 50 tests/sec, then data files will consume about 500MB of disk space.
See also: Auditing Tool -> Log files
|
|
HM system log |
HostMonitor uses the system log to record events like start/stop monitoring, as well as information on started and/or
failed alert actions. You can either specify a particular file name for the log, or use
date macro variables to have HostMonitor switch to a different file every day,
week, month or year.
There are two more options available:
- Record info about successful actions
- Record info about failed actions
You can select one, both, or non of these options.
To get more information about different logging options available in HostMonitor, please, refer to
"Log & Reports" section.
|
|
User operations log |
HostMonitor may record operations performed by local or remote operators, operations performed by HM Script or HostMonitor
itself. It records information about enabled and disabled test items, paused and refreshed items, removed folders and tests,
modified folders, views and tests, started scripts, import operations and so on. Each type of operation has its own ID. List
of such operations listed in the manual (see manual.PDF, Appendix #2).
For each operation HostMonitor records:
- Event time
- Operator type (HostMonitor, local operator, remote operator, HM Script, import procedure)
- Unique ID of the operator and operator's name (for local and remote operators)
- Operation ID and operation name (XML log file contains operation ID only)
- Item ID (usually this is test ID or folder ID, e.g. if you move test item, this field will show test ID)
- Result (Done, Rejected or Failed)
- Description (may contain test name, folder name, some comments)
File name
If you enable this log, you should specify file name for the log using .html, .txt, .dbf or .xml file extension. HostMontor will
choose file format accordingly to specified file extension:
- Text - simple TSV (tab separated values) text file
- DBF - dBase file that can be opened by various database applications including Excel and Access
- HTML - Hypertext Markup Language, can be viewed by any modern web browser
- XML - the most versatile file format. It can be used for data import and processing; also
data from XML file can be displayed directly by web browsers. There is userlogstyle1.xsl file - sample XSLT file (styles
for XML file) that can be used with XML log. You may easily modify these styles or create your own styles and filters.
Also for group operations (e.g. you pause or disable set of selected test items) this format provides most compact records.
Also, you may set the following filters:
Results filter
You may choose what operations should be recorded (filter by operation result)
- Successful
- Rejected
- Failed
Operators filter
You may choose "operation source" that should be recorded:
- HostMonitor (e.g. HostMonitor itself may load specified test list on startup)
- Local operators (operators that work directly with HostMonitor console)
- Remote operators (users connected thru RCC, Web Service or Telnet Service)
- HM Script
- Import procedure
Include list of tests
Also you may enable "Include list of tests" option for group (bulk) operations such as:
- Tests imported from text file
- Folder refreshed
- Folder resetted
- Folder enabled
- Folder disabled
- Folder removed
- Folder copied
E.g. if you enable "Folder disabled" item in this filter, HostMonitor will record list of disabled tests when you perform
"Disable this folder" operation. Otherwise HostMonitor will write just 1 record with information about disabled folder.
|
|
External syslog |
|
HostMonitor may send test results, action results, diagnostic messages, RCI and Active RMA related messages to external Syslog server.
"External Syslog" page in Options dialog offers the following option:
Send logs to host
If you want to send data to external Syslog server, mark this option and provide hostname or IP address of the server
Port
Specify port on which Syslog server is listening for incoming UDP packets (UDP protocol is suitable for fast, efficient transmission
however there is no guarantee that all messages sent would reach the server)
Test results
Mark this option if you want to send test results to Syslog server. Note: if you want to send results of some specific test item, you may use Syslog action instead
Message template
Here you should specify syslog message template. Format of the message is up to you; you may use the macro variables to put in as much
details as you want. For instance template might look like this: [%TestID%] %TestName% status: %Status% %Reply%
| Brief mode | send data to the server when test status changes |
| Reply mode | send data to the server when test status or reply value changes |
Facility - specify facility number for messages related to test results
Action results
Mark this option if you want to send action results to Syslog server.
| Send errors | send data to the server when action failed for some reason |
| Send all results | send information about failed and executed actions |
Facility - specify facility number for messages related to action results
Monitor messages
With this option enabled HostMonitor will send diagnostic messages to the server
| Send errors | send to the server error diagnostic messages (e.g. HostMonitor cannot open RCI port for listening, cannot create report or ODBC logging pool is full) |
| Send all results | send to the server all diagnostic messages |
Facility - specify facility number for diagnostic messages
Active RMA log
Information about connection requests from Active Remote Monitoring Agents will be sent to the server when this option enabled:
| Rejected requests | with this option selected HostMonitor will send information about rejected connection requests from Active RMA |
| All connections | HostMonitor will send information about rejected and successful connections from the agents |
Facility - specify facility number for messages related to Active RMA
RCI log
Information about connection requests from remote operators will be sent to the server when this option enabled:
| Rejected requests | with this option selected HostMonitor will send information about rejected connection requests from the remote users. E.g. RCC, Web or Telnet operator tried to connect from non-allowed IP address or used invalid password |
| All connections | HostMonitor will send information about rejected and successful connections from the remote users (RCC, Web Service and Telnet). Options located on RCI page tell HostMonitor to exclude or include WatchDog account (account used for WatchDog application). |
Facility - specify facility number for Remote Control Interface messages
Facility
The logging facility parameters allow administrators to logically separate messages. Messages with different facilities may be handled differently, e.g. write records to separate files, forward them to different destinations, etc.
That's why HostMonitor allows specifying facility number for each kind of logging data.
Severity
Severity level of the message set automatically by HostMonitor:
| Critical | - reserved for cluster mode, not used yet (e.g. cluster node disconnected) |
| Error | - tests status changed to "Bad", "No answer" or "Bad contents";
- action failed;
- error diagnostic message (e.g. HostMonitor cannot create report or ODBC logging pool is full) |
| Warning | - test status changed to unknown or warning;
- rejected RMA and RCI connections (e.g. IP address not allowed or invalid password used) |
| Notice | - other test statuses (e.g. test status changed to "Ok" or test was disabled);
- operator acknowledged "bad" test status;
- acknowledged test fails again with different reply |
| Informational | - executed actions;
- accepted RMA and RCI connections;
- informational system messages (e.g. monitoring started) |
|
|
Log processing |
|
HostMonitor can switch from primary to backup log when necessary or use both logs at the same time. Choose
one of the following options:
- Use backup log when primary is not accessible
If both logs are specified, HostMonitor uses primary log until 1st failure. When logging operation
fails, HostMonitor switches to backup log right away. However it will try to use primary log for the
following test probes and switch back to primary log in case of success. If logging operation fails 8
times in a row, HostMonitor will not check primary log for the next 5 min.
- Use primary and backup logs all the time
This option tells HostMonitor to use both logs at the same time. It has sense when you are using
different logging options for primary and backup log. E.g. you may use Full logging mode for primary
ODBC log managed by your SQL server and use Brief logging mode for backup HTML log stored on local
hard drive.
Special file processing
The following options allow you to manage log files: e.g. you may set HostMonitor to remove files older than 3 months,
or you may configure HostMonitor to keep just 2 log files - for previous and current month.
There are 2 similar sets of options: one for common log files, another - for private log files.
You may define command line for execution and choose one of 3 available options to specify when HostMonitor should
execute external command for processing common log file(s):
- If common log(s) was created <N> days/weeks/months/years ago
with this option selected HostMonitor will apply specified external command for each log file that was created
specified number of days/weeks/months or years ago. HostMonitor checks age of log files once a day (normally at
midnight).
- If common log(s) is bigger than <N> KB
with this option selected HostMonitor will apply specified external command for current log file only when its
size reaches specified limit. ("current" means this option does not affect old log files into which no records
are added anymore).
- If common log(s) is switching
with this option selected HostMonitor will apply specified external command for current log file when
HostMonitor switches to another (new) log. E.g. if you use "Automatically change the log every month" option,
HostMonitor will execute specified command before creating new log at midnight every 1st day of every month.
Please read notes below. Some important restrictions apply to external programs:
You may choose one of 2 options to specify when HostMonitor should execute external command for processing private
log file(s). They could be same as for common log (above) or different:
- If private log(s) was created <N> days/weeks/months/years ago
with this option selected HostMonitor will apply specified external command for each log file that was created
specified number of days/weeks/months or years ago. HostMonitor checks age of log files once a day (normally
at midnight).
- If private log(s) is bigger than <N> KB
with this option selected HostMonitor will apply specified external command for current log file only when its
size reaches specified limit. ("current" means this option does not affect old log files into which no records
are added anymore).
Please read notes below. Some important restrictions apply to external programs:
Execute command:
You may specify 2 commands for execution: one for common log files, another for private logs. You may use special
variables in the command line:
| %log% | - represents full name (including path) of the log file (e.g. C:\Program Files\HostMonitor\Logs\04-2004.htm) |
| %logpath% | - represents path to the log file (including trailing back slash. E.g. C:\Program Files\HostMonitor\Logs\) |
| %logname% | - represents name of the log file (e.g. 04-2002.htm) |
| %logext% | - represents extension of the log file (e.g. ".htm") |
(!) Please note:
When you design external command/application for log processing you should consider following: external application
MUST NOT lock CURRENT log file for more than 60 seconds. If it does, HostMonitor will terminate external
application to unlock the log.
So, if you want to perform some operation that can take more than 60 sec (e.g. pack log file or move it to slow
backup device), move it to another folder or rename log file first and then start slow process.
See example #4
On the other hand, this limitation is not applicable for processes that work with old log files. If you change log
file dynamically and want to pack old log files, you may do this without any restrictions. See example
#2 and #3
Examples:
- If you want to keep 2 log files at any moment: one log for current month and another for previous month, you may use following settings:
- If common log(s) was created 1 month ago execute command cmd /c move /y "%log%" "%logpath%oldlog%logext%"
- Name of the log file could be static, you don't need to use "Automatically change the log every month" option (but you may use this option if you want)
Please note: 1 month ago doesn't mean exactly 1 month (30 or 31 days) ago. It means "previous" month. E.g. if
log file was created in October (any day of the October), HostMonitor will execute specified command on November
1st.
- If you want to keep log files for last 3 months, you may use following settings:
- If common log(s) was created 3 months ago execute command cmd /c del "%log%"
- Name of the log file should be dynamic. Use Automatically change the log every month (week or day) option
- if you want to zip old log files once a year,
- use "Automatically change the log every month (week or day)" option
- set If common log(s) was created 1 year ago execute command pkzip c:\logs\archive.zip "%log%" option
Here you may start archive program to pack log file. It will lock the file but it's not a problem in this case -
HostMonitor switches to a new log (because of "Automatically change the log..." option)
- If you want to zip current log file when it reaches 1,000,000 Kb simultaneously starting new log, this is more complicated because archiver is not allowed to lock log file for more that 1 minute.
One of possible solutions:
- you may create simple BAT file with the following commands
cd %~p1
mkdir tmp
move /y %1 tmp\%~n1%~x1
pkzip c:\logs\archive.zip tmp\%~n1%~x1
Comments:
3rd command moves log file, it allows HostMonitor to create new log. If you move file within the same drive,
Windows moves it fast;
4th command starts archiver that may pack new (moved) file as long as it needs, HostMonitor will work with
another file
- use If common log(s) is bigger than 1000000 Kb execute command cmd /c NameOfTheBATfile.BAT %log% option to start that BAT file
If you set Private logs for 10,000 test items and tell HostMonitor to set new log files on daily basis, then you will have 300,000
log files just in one month; 3,650,000 log files per year. HostMonitor v12.42+ uses low priority thread usually started after midnight
to process log files. You may set specific time for log processing using DailyTime parameter in [Logging_PrivProcessing] section of
HostMon.INI file (e.g. DailyTime=0222 tells to start log processing at 2:22 AM).
The following options (when set) can trigger log processing commands during daytime:
- if common log is switching
- if private logs is bigger than N KB
usually this is not a problem, these commands will process just 1 log file, not 300,000 files
|
|
HTML Colors |
Customize color scheme for HTML log files. You can use Color Profiles dialog to
select scheme or create new one (use button to the right of the Scheme Name box to bring up Color Profiles dialog).
|
|
Log Viewers |
For each type of log file (HTML, Text, DBF) select one of the options:
- Internal - use the build-in viewer
- Associate program - use the default Windows viewer for file
- External - use an external viewer. Define a command line to start the program that will be used as the viewer.
The name of the log file to view can be passed to this program as a parameter using macro variable %LOG%.
E.g. "notepad.exe %Log%"
|
|
Reports |
HostMonitor can generate HTML, DBF, WLM, and Text reports with the information about tested hosts (e.g. for publishing on
your WEB or WAP site, for sending with E-Mail notification, or for analyzing). On this page you can define a list of up
to 6 global reports (reports that apply to all tests in the working HML file). Just select report profile from drop-down
list and specify name of a target file (you can use a naming pattern to
have HostMonitor switch to a different file every day, month, year, etc.,
as prescribed by the date macro variables
appearing in the pattern).
Also you can bring up Report Manager dialog to configure an
existing report or create a new one.
There are two more parameters that can be specified on this page:
Generate reports every N min
Tells HostMonitor how often reports should be generated
Execute action profile when complete
With this option enabled HostMonitor will launch the specified alert profile after reports were generated (for
example you may use this option to send reports by e-mail). Note: only "scheduled"
actions will be executed, i.e. a condition to start action should be set to "on the schedule" (in
Action Properties dialog).
Use "Generate reports now" button to immediately create reports (for testing purposes).
- Note #1: Additionally, each folder may have its own report list; only the tests contained in the folder will be used
to generate these folder-specific reports. For more information about folder, please, refer to "Folders"
section of this documentation.
- Note #2: To exclude some tests from reports use test property "Exclude from reports".
- Note #3: If you need to create reports every time a test changes its status add the "Generate reports"
action to the Actions Profile. The other way to implement the same behavior would be to add a
"Run HMS Script" action, and include a CreateReport command in the script to execute.
- Note #4: Also reports can be generated at user request at any time through the Reports menu in HostMonitor's main window.
|
|
Message window settings |
HostMonitor can display a popup window when a test changes its status
(as long as you specify the "Show message" option in the alert profile for the test).
On this page of the Options dialog window you can define the parameters for this popup window.
Position
You can choose "Predefined position" option and define the coordinates for the top left corner of the window.
Or choose "Show in the last remembered position" option and HostMonitor will remember the window position on the screen
and will display the popup window in the same location.
Time live
- "Close after N sec" - Select this option and specify the amount of time a window will stay
open before automatically closing, unless the [Close] button is selected or
the [Stop] button is used to stop the countdown.
- "Close manually" - Window will stay open on screen until the [Close] button is used.
Stay on top
Popup window will appear in front of all other windows
|
|
Mailer |
|
On this page define the settings for the build-in mail client.
Primary SMTP Server
Address
IP address or hostname of your SMTP server.
Port
TCP port number used by the mail server for incoming connections (normally SMTP servers use port #25 unless server requires secured connection).
TLS
This option allows you to use secured and encrypted connection. You may set "None" option to use unencrypted connection, select
"Implicit" or "Explicit" to use encrypted connection.
Note: normally mail servers that use "Implicit" security mechanism accept connections
on TCP port 465; "Explicit" security mechanism usually uses TCP port 587; however non-standard ports can be used by your mail server.
Authentication method
Select one of the authentication methods: None, Plain, Login, Cram-MD5, CRAM-SHA1, NTLM or POP before SMTP
* POP before SNMP option notes: HostMonitor chooses the TCP port for POP3 connection based on TLS mode (None-110, Implicit-995, Explicit-995). You can also set a specific port for POP3 connection when POP before SMTP authentication mode is used: add 1 or 2 lines in hostmon.ini file, [SMTP] section. E.g. if you want to set TCP port 2095 for the primary mail server and port 110 for the backup mail server, add the following 2 lines to the [SMTP] section and restart HostMonitor
Pop3Port1=2095
Pop3Port2=110
Login
Specify login (if authentication method is not None)
Password
Define password (if authentication method is not None)
Note: if you are using Google mail service, you may need to create App Passwords and use this password
for authentication (set "Login" authentication method). "Sign in with Google" option cannot be used,
normally HostMonitor is running as Windows service and should be able to send e-mail alerts without user
interaction
https://support.google.com/accounts/answer/185833
The same parameters you can define for the Backup SMTP server. When HostMonitor tries to send e-mail, at first it uses
Primary SMTP server. If in consequence of some error this is impossible, HostMonitor tries to send e-mail using
Backup SMTP server.
Show status window when sending mail
With this option enabled, HostMonitor will display a window when sending e-mail and show all requests to and answers
from the mail server.
Close on disconnect, delay closing for [N] sec
If you enable this option, HostMonitor will close the window after a specified time interval after disconnection.
Or, press the [Close] button to close the window immediately or the [Stop] button to continue displaying the window
on the screen.
Show in the last stored position
The status window will save its coordinates and restore back to those coordinates when displayed again.
|
|
Pagers |
Use this page to setup general settings for the subsystem which sends messages to pagers and beepers.
Information related to specific pagers may be defined in each action profile.
Device
Specifies your TAPI device (modem) which will be used by the program.
Select a modem from the drop-down list or select the "Auto select free TAPI device item.".
In this case HostMonitor will search through all the compatible devices on
the system and attempt to send the message. If one port is busy, it will
try the next port until it has exhausted all the compatible TAPI ports.
Baud rate
Specifies the baud rate that will be used to communicate with your modem. This can be any of the following: "300", "1200", "2400", "4800", "9600", "19200".
Modem init string
This is the initialization string for your modem. The modem must then respond with an "OK".
You can leave the default value as "AUTO" in this parameter. HostMonitor will search
your Modem's INF file from Windows and prepare a string that will work with most paging carriers.
If the default string does not work, you will need to search the modem's manual and figure a string that will work.
Any time you need to replace the string use the tilde character (~) (i.e. AT&F~). If you need to pause, the hat character (^) will give you a one second pause. (i.e. AT&F~^^AT~).
The maximum length of the modem initialization string is 80 characters.
Specify a termination string by placing a vertical bar (|) after the modem init string.
By specifying AUTO, it will use the strings specified in the modems INF settings. Examples: (AT~|ATZ~) (AUTO|AUTO)
Modem dial string
This is the string the program will send to the modem when it is ready to dial.
The default value is "ATDT". If only a pulse dialtone is available, "ATDP" must be passed to this parameter.
To control how long HostMonitor will wait for a connection before giving up, pass "TO=20" where 20 is the number of seconds desired.
For example, the string to use here is: "TO=20,ATDT".
Show status window when dialing
HostMonitor can display a window when sending messages to a pager, displaying how it sends the message and the results of the operation (also, the program writes the result of sending the message into a log file).
Close window on disconnect, delay before close [NN] sec
After a specified time interval, HostMonitor will close the message window after sending the current message.
Press the [Close] button to close the window immediately or the [Stop] button to keep the window onscreen indefinitely.
If device(s) busy wait up to [xx] min
Specify how long the program will attempt to resend messages.
|
|
ICQ |
If you want to use "Send message to ICQ" action method, specify parameters
of your primary and backup (optional) ICQ accounts here. For each account you should provide UIN and password.
Why do you need backup account?
HostMonitor utilizes message queue, uses deferred logout algorithm and some other tricks to make message
delivery as reliable as possible. However ICQ servers use anti-spam technologies and may temporarily lock
your account or do not accept messages for a while. When this happens HostMonitor switches to backup account.
If you do not specify backup account, HostMonitor will utilize flow control options provided by ICQ protocol.
Please note: we do not consider "Send message to ICQ" action as reliable way to notify network administrators about critical network problems.
|
|
Jabber |
If you want to use "Send message to Jabber" action method, specify parameters of
your primary and backup (optional) Jabber accounts here. For each account you should provide the following parameters:
Login server
Host name or IP address of the server
Jabber ID (JID)
Every user on the network has a unique Jabber ID (usually abbreviated as JID). To avoid the need for a central server with a list of IDs,
the JID is structured like an e-mail address with a username and a DNS address for the server where that user resides separated by an
at sign (@), such as username@domain.com
Password
Password
SSL/TLS
This option allows you to use secured encrypted connection. You may set "None" option to use unencrypted connection, select "Implicit"
or "Explicit" to use encrypted connection.
Note: normally Jabber servers that use "Implicit" security mechanism accept connections on TCP port 5223; "Explicit" security mechanism
usually uses TCP port 5222
Port
TCP port used by the server. Normally Jabber server listens on port 5222
When you specify login server you should provide the host name (e. g. www.jabber.org) or IP address (e. g. 204.71.200.68).
Also you may provide IPv6 addresses (e.g. fe80::370:ff56:fed5:22) and specify hostname with suffixes
::ipv4 or ::ipv6 (e.g. www.jabber.org::ipv4 or
www.6bone.net::ipv6).
If you specify hostname without any suffix, HostMonitor will try to resolve name into IP address using IPv4 protocol. If name cannot be
resolved by IPv4 protocol, HostMonitor will try to use IPv6 protocol. If you specify hostname with ::ipv4
(or ::ipv6) suffix, HostMonitor will use IPv4 (or IPv6) protocol only.
Note: on Windows NT 4.0, Windows 2000 and Windows XP SP1 IPv6 protocol is not supported. You may use menu Tools -> Local Info
to check is your system IPv6 ready.
|
|
SMS: GSM |
If you have GSM modem (cell phone) connected to the system where HostMonitor is running and you want to use
"Send SMS" action to send SMS messages to your support staff or some devices,
specify parameters of your primary and optional backup GSM modems here.
If you have 2 modems connected to the system and HostMonitor cannot send SMS through the primary modem,
it will try to send messages using backup cell phone.
For each GSM modem you should specify the following parameters:
COM port
Specify COM port to which GSM modem is connected.
Baud rate
Specify the baud rate that will be used to communicate with your modem.
Modem type
Choose type of the cell phone that you have connected to the system. HostMonitor supports the following devices:
- Ericsson GM12
- Ericsson K750i
- Ericsson W660i
- Huawei E220
- Huawei Mobile Connect 3G
- Maestro 20 GSM
- Motorola G20
- Motorola T260
- Multi-Tech MTCBA-E
- Multi-Tech MTCBA-G-F1-EU
- Nokia 6210
- Nokia 6310i
- Nokia 6650
- Nokia 9110
- Nokia N30
- Siemens A1
- Siemens M1
- Siemens M20
- Siemens M35
- Siemens ES75
- Siemens TC35
- Siemens S25
- WaveCom
- Wavecom Fasttrack
- Z-text Fixed Line SMS modem
If you do not see your phone in the list, you may try to choose similar model. For example Seimens C45 and
Siemens S45 both work like Siemens M35
Also, you may choose Custom mode
Mode
Choose the type of SMS format that should be used by your GSM modem. When the modem supports both formats
(Text and PDU), the PDU mode is recommended
PIN
Provide PIN of the SIM card installed in your modem (cell phone)
Service center
The SMS center number, e.g. +17044100000 (Sprint, USA), +17057969300 (Rogers, Canada) or +491710760000 (D1, Germany)
Logging options
SMS module has its own logging options. Why? HostMonitor puts messages into query and does not spend its
resources to manage GSM modems. Separate module, called SMS spooler, manages messages and works with the modems.
SMS log
Choose one of the following logging options:
- No log
- Failed events only
- Failed and successful events
- Detailed tech info
Log file
Provide the path to the log file. If you use .HTM or .HTML extension for the file, SMS spooler will create
log file in HTML format, otherwise TEXT format will be used
Custom AT commands
When you choose "Modem type: custom" HostMonitor creates simplified script for your modem considering PDU/Text mode,
PIN number, service center number. E.g. commands may look like
AT+CMGF=0
AT+CMGS=%PDULen1%>%Message0PDU%^Z
another example
AT+CPIN="1111"
AT+CSCA="+12065415500"
AT+CMGF=1
AT+CMGS="%DestPhone%">%MessageText%^Z
Also, this mode tells HostMonitor to ignore most of errors, often SMS can be delivered even if some commands were rejected by modem.
You may modify commands manually, using different commands for primary and backup modem. Use the following variables and special symbols:
| ^Z | as EOF symbol |
| ^J | as LF (line feed) symbol |
| > | tells HostMonitor to wait for > prompt from modem |
| %DestPhone% | destination phone number specified for the action |
| %MessageText% | text message created by "Send SMS (GSM)" action according to specified template and test results |
| %MessagePDU% | the message encoded as Packet Data Unit (includes destination number, does not include service center number) |
| %Message0PDU% | the message encoded as Packet Data Unit with leading 00 characters (includes destination number, does not include service center number) |
| %MessageSCAPDU% | encoded packet with service center number, destination number and the message |
| %PDULen% | size of the PDU message |
| %PDULen1% | size of the PDU message (%PDULen1%==%PDULen%+1) - for some modems you need %PDULen%, for other %PDULen1% |
Test
"Test" button allows you to check your settings and modems right away.
Please note:
- HostMonitor will not send testing SMS when SMS spooler is busy sending messages that were initiated by "Send SMS" alert actions.
- SMS Test window will display technical information about your testing SMS; then it may display information about SMS messages that were initiated by "Send SMS" action started at the test execution time (if any).
|
|
SMS: SMPP |
In order to use "Send SMS (SMPP)" action you should specify parameters of
your primary and optional backup SMPP accounts. If you provide 2 SMPP accounts and HostMonitor cannot send
SMS through the primary account, it will try to send messages using backup account.
For each account you should specify the following parameters:
Host
Provide host name or IP address of the Short Message Service Centre (SMSC).
Port
Provide the port that SMSC is listening on for connections from SMPP clients.
System ID
Provide the account that should be used to login to the SMSC.
Password
Provide the password that should be used to login to the SMSC.
Source Address
Specify source address
Source TON
Type of the Number (TON) used for "Source Address". Choose one of the following options:
- Unknown
- International
- National
- Network Specific
- Subscriber Number
- Alphanumeric
- Abbreviated
We recommend using "International" format of the adresses (number starts with the country code followed by the national destination code and the subscriber number, e.g. +17057969345).
Source NPI
Source Numbering Plan Indicator (NPI) - type of numbering scheme used in telecommunications. Choose one of the following options:
- Unknown
- ISDN (E163/E164)
- Data (X.121)
- Land Mobile (E.212)
- National
- Private
- ERMES
- Internet (IP)
Please consult with your SMPP service provider for the list of supported options.
|
|
Ping/Trace |
On this page specify parameters for the Trace utility and for Ping tests.
Packets to Send
Specify the number of ECHO packets.
Packet Size
Specify the size of ECHO packets.
Timeout
Specify a timeout interval in milliseconds.
Time to Live
Specify a TTL value. TTL (Time To Live) - a technique used in best-effort delivery systems to avoid endlessly looping
packets. For example, each IP datagram is assigned an integer time to live when it is
created. IP gateways decrement the time to live field when they process a datagram and
discard the datagram if the time to live counter reaches zero.
Number of Hops
Specify the maximum number of hops to reach the target.
This is a measure of the distance between two points on the Internet.
A hop count of n means that n gateways separate the source and destination.
Clean old info at start
If selected, Trace utility will clear the output window before perform new test.
Show Host's Description
If option is enabled, the program will display a description of the host beside host name in the Trace utility.
Example:
... www.chat.ru (Russia)
... mainboss.xaxa.BD (Bangladesh)
... www.gazprom.ru (Join-stock company GAZPROM, Moscow, Russia)
Stop tracing when a non-responding device is encountered
By default Trace utility stop tracing when some device does not respond. When you disable this option HostMonitor
will continue trace until reach destination host.
|
|
RCI (Remote Control Interface) |
RCI is a feature of the monitor that allows you to check and control HostMonitor remotely (using web browser or
telnet client). RCI uses TCP/IP protocol and needs just one TCP port. On this page you may setup different
parameters of the interface:
Enable Remote Control Interface
HostMonitor will accept remote control requests and commands only when this option is enabled. This is the main
"switch" of all remote control functions of HostMonitor.
Listen for incoming connections on port
Here you may specify the TCP port number which HostMonitor will use to listen for incoming requests and commands
from Web Service or Telnet Service.
Note that both Web Service and Telnet Service should be configured to use the same TCP port number as the
HostMonitor itself.
Timeout
This is the maximum amount of user inactivity time which HostMonitor will hold an established connection with the
remote user. If the remote user after establishing the connection with HostMonitor does nothing (i.e. does not sends
any control commands) HostMonitor will drop this connection after the specified amount of time expires.
Maximum simultaneous connections
This option specifies the maximum number of simultaneous remote connections that HostMonitor may accept from the
remote users.
It is important to note here that even just one user that connects to HostMonitor via web browser may generate
several simultaneous connections. When an internet browser acquires the document from the internet it may fetch
several parts of the document at once to increase performance. Thus "Maximum simultaneous connections" option of
the HostMonitor's RCI interface should be set to 8 (minimum) if you plan to use web browser to control HostMonitor
(even if just one user at a time will be connected to HostMonitor). Otherwise the web browser may not be able to
display a web page with an interface of the HostMonitor correctly.
User profiles button
This button brings up a User Profiles dialog. There you can specify (for each user account separately) a list of
authorized IP addresses from which a connection to HostMonitor can be accepted and a list of authorized operations
(such as start/stop of monitoring, enable/disable tests, etc) that are allowed for each user. Only "Admin" and
users that already have permissions to modify accounts of other users may access the User Profile dialog.
The following group of check boxes specifies the types of events (associated with Remote Control Interface) that
HostMonitor will or will not add to system log:
Record info about accepted connections / including WatchDog account
You may enable or disable recording the information about successful connections from the remote users.
You may apply this option for all accounts or you may exclude account used for WatchDog application.
Record info about rejected connections / including WatchDog account
Disable or enable recording the information about rejected (by a HostMonitor) connections from the remote users.
You may apply this option for all accounts or you may exclude account used for WatchDog application.
Record info about accepted/executed commands
Disable or enable logging of accepted commands.
Record info about rejected/failed commands
Disable or enable logging of rejected commands.
|
|
Active RMA Server |
Options located on this page allow you to specify TCP port that will be utilized by HostMonitor to listen for
incoming connections from Active RMA agents.
Also it allows you to setup filter for IP addresses
- Accept connections from any IP address
Enabling this option will allow HostMonitor to accept connections from any IP address (as long as the
incoming RMA request provides correct name and password)
- Accept connections from the following IP addresses
This option allows you to specify the list of IP addresses. After enabling this option HostMonitor will
accept remote connections only from the addresses within this list (password is required as always).
Please note:
- to insert new address press INSERT button; to remove item press CTRL+DEL; to edit item press Enter or double-click it
- you may specify ranges of IP addresses from which a connection may be accepted. E.g. 192.168.1.1 - 192.168.1.100
The following options specify the types of events that HostMonitor will or will not add to
system log:
Record info about accepted connections
You may enable or disable recording the information about successful connections from Active RMA agents.
Record info about rejected connections
Disable or enable recording the information about rejected (by a HostMonitor) connections from the agents.
|
|
Scheduler |
HostMonitors` built in scheduler. Here you may specify which action profiles HostMonitor will execute on schedule.
You have five separate entries in the list. Each of the entries has the following schedule options:
- "None" - no action (alert) will be performed.
- "Regular" - specify the time interval (e.g. every 60 minutes) to perform action profile.
- "Daily" - an action profile will be executed every day at a specified time of the day. Note: the time of the day is specified in 24h format.
The action will not be performed a second time on the same day, even if you manually change the scheduled time.
- "Weekly" - an action profile will be launched once a week on specified day of the week at a specified time of the day (e.g.: weekly, every Tuesday at 22:00).
- "Monthly" - once a month, on a specified day of the month, at a specified time of that day (e.g.: every 5-th day of the month at 7:00).
Use "Last day" option to start action profile on the last day of the month (you don't have to worry how many days it is in the current month).
- "Quarterly" - an action profile is performed once in a quarter on a specified day of the FIRST month of each quarter (1,4,7,10 month) at the specified time.
Please note: if you are using "Quarterly" schedule with "Last day" option, action will be performed on the last day of the LAST month of each quarter (3,6,9,12 month).
You may set maximum five schedules of a/m types. In each schedule you may select an action profile that will be
executed accordingly. Use the drop down list to select action profiles. By clicking the button next to a drop down
list you will access the Action Profiles dialog window where you may add new
action profiles and actions or edit the properties of existing actions.
Note: only "scheduled" actions will be executed by Scheduler, i.e.
a condition to start action should be set to "on the schedule" (in Action Properties dialog).
|
|
Miscellaneous |
Use fixed date & time formats
By default HostMonitor gets current Windows regional settings at startup and uses these parameters until you change
Windows settings and restart monitor. You can mark this option and define date & time formats. In this case,
HostMonitor will use the specified formats, regardless of the system settings.
Reports & Statistics
ODBC related options
RMA / Logging
Update check
SSL options
Settings for URL tests
Settings for UNC tests
NT Event Log test related option
Performance Counter test related option
Settings for SNMP Get tests
Settings for SNMP Trap tests
Settings for Traffic Monitor tests
Reports & Statistics
Reports:
- Show folder names
With this option enabled HostMonitor inserts into reports additional line with the name of folder preceding the
list of tests in this folder. Compact HTML and Dashboard reports always display folder name, regardless of this
option.
- Skip empty folders
With this option enabled folders that do not contain any tests will not be included into reports. Otherwise
report will display single line (row or cell - it depends on report type) with the folder name.
Statistics:
- Display Alive/Dead ratio of passed/failed tests
- Display Alive/Dead ratio of alive/dead time
This switch defines how Alive/Dead/Unknown ratio should be calculated: it is either based on quantity of
passed/failed probes (HostMonitor version 3 and 4 supported this mode only) or based on alive/dead time
(new mode). New mode is useful when you setup HostMonitor to change test intervals for failed tests.
- Precision: display [N] digit(s) after decimal
Sets precision of the Alive%, Dead%, Unknown% fields
ODBC related options (following options
have effect for ODBC tests, ODBC logging, and "SQL Query" action)
User DSN/System DSN
As you know Windows has system data source names (System DSN) and user
data source names (User DSN). System data sources are local to a computer
but not user-dedicated; any user with privileges can access a system DSN.
User data sources are local to a user and accessible only by the specified
user. Using "User DSN/System DSN" option you can choose which data sources
list will be used by HostMonitor.
Please note if you start HostMonitor as service, it will not be
able to use User DSN. Only System DSN will be used .
So, if you are planning to start HostMonitor as service and as regular
application, use "System DSN" option. In this case HostMonitor will
work equally in both modes.
Do not use SQLFetchAbsolute command
Not every ODBC driver supports SQL_FETCH_ABSOLUTE command. HostMonitor
tries to use this command and if driver returns error, HostMonitor use
cycle with SQL_FETCH_NEXT command.
It works fine with most ODBC drivers. However ODBC driver which comes
with Oracle client v.8 (and may be some other drivers) has bug in error
handler. This bug can cause ODBC driver to crash.
That's why this option was implemented. Use it if you experience problem
with ODBC driver.
Enable connection pooling
This option enables an ODBC driver to reuse a connection from a pool of connections. Once a connection has
been created and placed in the pool, driver can reuse the same connection without performing the complete
connection process. This can increase performance of HostMonitor.
PS.: ODBC driver manager controls the number of connections in the pool, HostMonitor cannot change it.
RMA / Logging
If backup agent is specified and connection to primary RMA failed
- Set "Unknown" status, log the error, then repeat test using backup agent
- Request backup agent without reporting error
If you setup primary and backup agents, HostMonitor will be able to
balance load between agents and use the backup agent when primary one does not respond.
This option defines behaviour of the tests in case primary agent does not respond.
Log: record info about inactive statuses (Disabled, Wait for Master, Paused)
Normally HostMonitor records information about every status change. If you disable this option,
HostMonitor will not record information about "inactive" test statuses.
Update check
This option tells HostMonitor to check for software updates at https://www.ks-soft.net/ every 3rd night.
If new version detected, HostMonitor will inform logged in operator (next morning). HostMonitor also checks
your license and informs operator about validity of the registration code for this new version.
Also you may use menu item "Help" -> "Update check" to check for software updates at any time convenient
for you.
SSL options
The following set of options allows you to configure SSL parameters for POP3, IMAP, E-Mail, Mail Relay and LDAP test methods.
There are similar set of options for each network protocol: POP3, IMAP and LDAP
Accept SSL/PCT certificates with invalid host name
This option tells HostMonitor to accept SSL certificate when certificate CN does not match target server name.
Accept SSL/PCT certificates with invalid dates
Disables function checking of SSL/PCT-based certificates for proper validity dates. In other words: this option tells HostMonitor to accept expired certificates.
Ignore unknown certificate authority problems
With this option enabled, HostMonitor will accept security certificates issued by any company. When this option disabled, certificate should belongs to trusted company.
URL test related options
Do not check Internet connection
Normally HostMonitor checks if computer connected to Internet before "URL request" test (to avoid appearance Dial-Up dialog).
With this option enabled HostMonitor will not perform this check.
Agent name
Some server-based scripts can check agent name and returns different information for different HTTP agents
(e.g. generate different HTML pages for IE or Netscape). You can change this parameter to get correct results.
Accept SSL/PCT certificates with invalid host name
Disables function checking of SSL/PCT-based certificates that are returned from the server against the host name given in the request.
Accept SSL/PCT certificates with invalid dates
Disables function checking of SSL/PCT-based certificates for proper validity dates.
UNC test related options
UNC test mode
This parameter defines behavior of UNC tests. Select 1 of 3 options:
- Normal - HostMonitor can start many tests simultaneously.
- OnePerServer - HostMonitor will start only 1 test per server at one time, but can start several tests for different servers at the same time.
- OneByOne - only 1 attempt at one time (one attempt means - if "UNC test retries" value greater than 1,
HostMonitor tries to get information from 1st server; if this try failed, HostMonitor will pause test for this
server and will try to check another servers, after 900ms HostMonitor returns to 1st server and performs 2nd attempt).
UNC test retries
Define how many times HostMonitor will try to get information from server (in one test)
Show errors description in "Reply" field when cannot access resource
If you check this option, HostMonitor will put error description in "Reply" field in case "UNC" test cannot access to resource.
NT Event Log test related option
Show events description in "Reply" field for "check NT Event Log" test
HostMonitor can show events description in field "Reply".
You can use %Reply% macro in e-mail body, in message for pager, etc.
Also this description will appear in reports, log file.
Performance Counter test related option
Test mode
Windows implementation of performance counters has bugs. E.g., Windows 2000 (Professional, Server, and Advanced
Server editions) can produce memory leak in PDH.DLL when user (application) querying performance counter that
does not exist. This bug fixed in SP2. Also PDH.DLL does not work correctly with multithread applications.
That's why in HostMonitor we have implemented several different methods to work with pdh.dll:
- MultiThread mode: HostMonitor works almost according to Microsoft documentation with some workaround to avoid
most likely problems. HM loads pdh.dll at once and uses it all the time. This method fast because HM can
start several tests simultaneously. If everything will work correctly on your system, use this method
(by default HostMonitor uses this method).
- OneByOne mode: Using this method HM will start Performance Counter tests one by one
This method is slow (when you setup Performance Counter test using Test Properties dialog program even
can hang for 1-2 min) but using this method you may avoid some problems due to a buggy pdh.dll
- Smart mode: With this method HM will try to detect when pdh.dll has to be reloaded.
- External mode: HostMonitor uses external (perfobj.exe) utility to perform the tests. This is fast and most reliable method.
PerfObj utility is included into package. Remote Monitoring Agent (RMA) can use this utility as well (utility
should be located in the same directory where RMA is installed).
If you want to change test method used by the agent, add line "PerfWorkMode=N" into [Misc] section of the
rma.ini file and restart agent. N is a code of the mode:
0 - MultiThread mode;
1 - OneByOne mode;
2 - Smart mode;
3 - External mode
"SNMP Get" test related option
Automatically append the single instance sub-identifier (".0").
Since the "SNMP test" is typically applied to single instance MIB objects that HostMonitor
automatically appends the single instance sub-identifier (".0").
Though this has an unfortunate side effect for table instance retrieval, to retrieve correct values for the table
instances disable this option.
"SNMP Trap" test related options
Here you may specify general settings of the SNMP Trap test method and provide special processing instructions
to warn you about high SNMP traffic from network devices.
Receive traps on UDP port #
This option specifies the UDP port number, which HostMonitor utilizes to listen for incoming messages. Default
setting is 162.
Unlike other test methods that are performed by specified time interval, SNMP Trap test method reacts on each
incoming message from remote network devices. Thus HostMonitor cannot predict how many messages will be received
and how often tests/actions will be performed, as a result HostMonitor cannot balance system load.
To prevent overload of the system (which may delay execution of other tests) we have implemented several options:
High traffic alert if more than NN incoming messages per NN sec
This option allows performing special actions when HostMonitor receives more than specified number of messages
within specified time. The purpose is to prevent system overload caused by improper configuration of some
network device or hacker's attack.
Note: this option has effect to HostMonitor and every Active
RMA that is listening for SNMP Trap messages.
Following options define what HostMonitor should do when high traffic is detected:
Suspend receiving messages for NN sec
With this option enabled HostMonitor ignores all incoming SNMP messages for next NN seconds. It reduces system
load and allows performing of other (non SNMP Trap) tests.
Note: this option affects HostMonitor and every Active
RMA that is listening for SNMP Trap messages.
Execute action profile
Here you may select action profile that will be executed when high traffic detected. E.g. it can inform network
administrator by e-mail or cell phone.
Note: only "scheduled" actions will be executed, i.e. a condition to
start action should be set to "on the schedule" (see Action Properties
dialog).
Note: This option affects HostMonitor only. Active
RMA that is listening for SNMP Trap messages does not execute specified action
profile; instead it sends information about high traffic to HostMonitor. HostMonitor in turn sets unknown status (and shows
"RMA: Too many traps received" error in Reply field) to all SNMP Trap test items managed by the agent.
Traffic Monitor related options
This parameter allows you to specify units that should be used to report amount of network traffic.
Choose one of the following options:
- Display traffic using KB / MB units
- Display traffic using Kbit / Mbit units
- Select units considering test settings (threshold value)
|
|
Command line parameters |
You can start HostMonitor using command line parameters (these parameters have priority before settings defined in the Options dialog) such as:
| /Ini=IniFileName | - | Read options from specified ini file, by default from "hostmon.ini". |
| /List=HostsFileName | - | After startup load specified TestList file (HML file with tests). |
| /ErrorHandler=Default | - | Normal startup (show error message (if one occurs) and continue). |
| /ErrorHandler=Ignore | - | Ignore all errors during startup (do not stop and display message). |
| /ErrorHandler=Quit | - | Quit if error (HostMonitor will display the message, wait 20 seconds and quit if operator does not press a key on the keyboard). |
| /start | - | Start monitoring after loading. |
| /stop | - | Do not start monitoring after loading. |
| /minimized | - | Minimize main window after startup. |
| /maximized | - | Maximize main window after startup. |
| /normal | - | Display window in it normal size after startup. |
| /InstallService | - | Install HostMonitor as Win32 interactive service. |
| /UninstallService | - | Uninstall service |
If you install HostMonitor as a service, the program will be started by the service control manager automatically during
system startup. For more information see "How to install HostMonitor as Win32 Interactive service"
section.
|