The Local Info utility examines the local host and displays information about the local computer
such as the processor, memory, Winsock data, network interfaces, IP (TCP,UDP,ICMP) statistics,
modems, route table, etc.
The information is displayed in a tree-like form organized
by categories. All or part of this information can be exported into a file
as plain text or HTML (sample)
The Connection monitor allows you to see all open connections on the computer it is running on.
IP-Tools displays the protocol, local IP address, local port, remote IP address, remote port and
its status for each connection. If you start the program on Windows XP system, IP-Tools will also
display name and PID (process identificator) of the process that uses TCP/UDP port.
When you select this page, the program refreshes the information.
You can also select the Refresh item from the local popup menu that appears
when you press the right mouse button or enable the AutoRefresh option and
specify an auto refresh interval on the Connection Monitor page in the Options dialog.
You can set up IP-Tools to display symbolic port names rather than port numbers,
resolve IP addresses to host names, and record all events to a log file.
You can also define selection criteria for the connections to display based on their type and status.
The possible state values for TCP sockets are as follows:
| CLOSED | - Closed. The socket is not being used. |
| LISTENING | - Listening for incoming connections. |
| SYN_SENT | - Actively trying to establish connection. |
| SYN_RECEIVED | - Initial synchronization of the connection under way. |
| ESTABLISHED | - Connection has been established. |
| CLOSE_WAIT | - Remote shutdown. Waiting for the socket to close. |
| FIN_WAIT_1 | - Socket closed. Shutting down connection. |
| CLOSING | - Closed, then remote shutdown. Awaiting acknowledgment. |
| LAST_ACK | - Remote shutdown, then closed. Awaiting acknowledgment. |
| FIN_WAIT_2 | - Socket closed. Waiting for shutdown from remote. |
| TIME_WAIT | - Wait after close for remote shutdown retransmission. |
This utility can be useful for detecting "trojan" programs (backdoors). Backdoors are remote-administration hacker tools that allow administrate remote computers on a network. The difference of backdoors from commercial network administration software is the silent installation and execution. When such a program runs, it installs itself into the system and then monitors your system without any requests or messages. In most cases you cannot find this application in the task list. Being installed on a computer, the backdoors may do everything their author has embedded into their feature list. Often the backdoors are able to monitor almost everything on affected computers, steal data from them, upload and run viruses on a remote PC, erase information, etc.
The NetBIOS utility displays NetBIOS information about the network interfaces.
You have to specify the target computer IP address or host name (such as "123.23.21.12" or "www.uc.com"),
or type '*' for the local computer and define the network interfaces number range (such as "0-3").
If the remote/local computer supports NetBIOS protocol, IP-Tools displays the information about the network interfaces such as the MAC address
for computers on the LAN, table of names, maximum number of sessions used, maximum number of the session packet size, etc.
The shared resources scanner is used to scan a range or list of hosts and gain
the list of shared resources such as disks and printers on each remote system.
Prior to scanning resources the NB Scanner utility can:
- ping the host
- resolve the IP address into a host name
- try to detect the operating system on a remote machine.
Results can be exported into a file as plain text or into an HTML report (sample).
Options for this utility located on the NB Scanner page in the Options dialog.
The Simple Network Management Protocol is the Internet standard protocol for exchanging management information
between management console applications and managed entities (hosts, routers, bridges, hubs).
SNMP Scanner allows you to scan a range or list of hosts performing Ping,
DNS and SNMP queries. For each SNMP responding device scanner displays the following information:
| • Host | IP address and optionally name of the host. |
| • Status | Status of the probe. If IP-Tools was able to retrieve necessary information from the host, this field shows reply time for SNMP request. Otherwise it will display error message briefly describing the reason of request failure. |
| • System ID | Enterprise OID or type of the system (E.g. "Windows Workstation", "Windows Domain Controler" or "1.3.6.1.3.9999"). |
| • System description | Description of the system (this field may contain information about hardware and software running on the host). |
| • UpTime | Represents the time interval since last initialization (boot, start-up) of the host. |
| • Router | Shows "Yes" if host is a router (device that forwards IP packets). Otherwise shows "No". |
| • Interfaces | Number of network interfaces on the host. |
| • TCP Curr/Max | Shows current number of established TCP connections and maximum number of TCP connections the host can support. |
| • Community | Community string that has been used to communicate with the host (you may setup a list of strings that will be used for communication with hosts; see Community strings option). |
System Info tool can be called from SNMP Scanner tool - just select discovered SNMP enabled host and use popup menu item "System Info".
Of course scanner is multithreaded; it can check multiple hosts simultaneously. As usually, information obtained by scanner could be saved into plain text file or as HTML report (use "Save as Text" or "Save as HTML" menu items).
All settings for this utility are located on "SNMP Scanner page in the Options dialog.
The Name Scanner is used to scan a range or list of IP addresses and resolve
the IP addresses into host names. To define the list of addresses to scan select
the ScanList page in the Options dialog.
The Port Scanner utility is used to scan hosts over a range or list of ports using the TCP protocol,
in order to see what services are available on the target systems.
Below is a list of some of the features of the Port Scanner utility:
- supports a range of addresses to scan such as "126.128.12.1 - 126.128.15.254"
- supports a list of addresses to scan (for more information refer to the section ScanList)
- can resolve the IP address into a host name prior to scanning its ports
- can ping the host prior to scanning its ports
- can send specific data to the open ports detected on remote system
- can display response from the remote system services
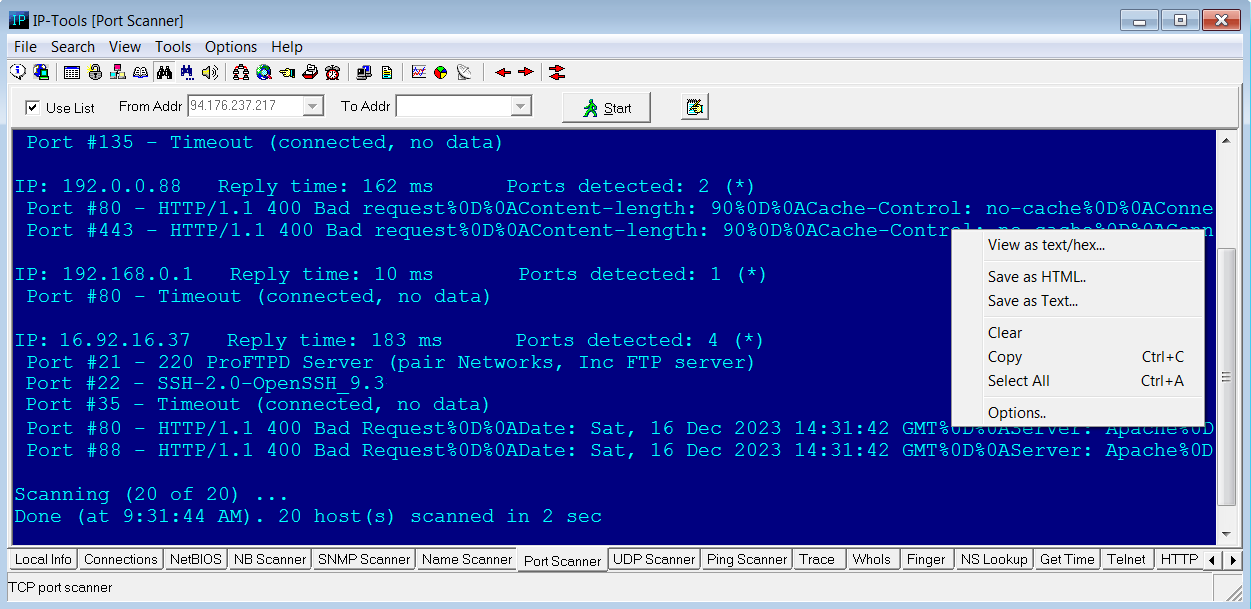
If for some open port long or non-ascii data received from the server, you may click right mouse button on reply line and choose "View as text/hex" item. IP-Tools will open additional window and show server response in text and hex formats.
A list of ports to scan must be defined before scanning can happen. You can either specify a comma-separated list of ports and port ranges, such as "21, 25, 43-80, 110-139", or select ports to scan on the Port List page in the Options dialog. Other settings for this utility can be found on the Port Scanner page in the Options dialog.
The UDP Scanner utility provides you with the ability to scan UDP based services (such as TFTP, SNTP, Daytime,
DNS, etc) over a range or list of IP addresses.
Here is a list of the features of the UDP Scanner utility:
- supports a range of addresses to scan such as "126.128.12.1 - 126.128.15.254";
- supports a list of addresses to scan (for more information refer to the section ScanList);
- can resolve the IP address of the hosts into a host name before scanning its ports;
- can ping the host before scanning its ports;
- can display response from the remote system services.
Unlike TCP, UDP is connectionless protocol. It means that you cannot use some standard method to establish connection between yours and remote systems and you cannot use exactly the same algorithm to check different UDP services.
Most of UDP scanners, those available in the Internet, attempt to identify opened UDP ports by sending a bogus UDP packet and waiting for an ICMP message 'PORT UNREACHABLE'. If ICMP packet will not be received, scanner assumes UDP port is in service. This method is simple but very unreliable:
| 1) | Not every OS sends an ICMP response to a client if there is an attempt to connect to a UDP port that has no application listening to on it. |
| 2) | Even if OS, in standard configuration, sends ICMP response, some antivirus/firewall software will change behavior of the system and will not send any response. |
| 3) | Even if remote system will send ICMP response, some routers and firewalls between yours and remote systems can drop this ICMP packet. |
That's why IP-Tools uses different way to check UDP services. For each UDP service you can specify data to send and condition that describes what answer is correct reply from the service.
For example: to check TFTP service fill up parameters with following values:
- Port: 69
- Filter: any reply
- Packet to send: %00%01filename%00%00netascii%00
where filename is the name of the file on the server. We recommend to provide incorrect (fake) name of the file. In this case server will not start file transfer and you will avoid unnecessary network traffic.
When you start utility IP-Tools will be sending UDP packets (using different data for different services) to each host from the list and will display list of services the answers received from.
This allows:
| 1) | to check availability of the UDP services more reliable; |
| 2) | IP-Tools can display reply from the service (in text and hexadecimal modes) which is useful when you need to check whether service is working properly or not; |
| 3) | for different services you can apply different filter conditions. IP-Tools will check reply from the hosts and display only services which satisfy filter conditions. |
IP-Tools contains preconfigured list of the popular UDP services (Echo, Daytime, Chargen, Time, DNS, TFTP, NTP,
SNMP, etc). You can change parameters of the checks and add checks for other UDP services.
For more information about options of the UDP Scanner, see "Options
-> UDP Scanner" section of this documentation.
The Ping utility verifies connections to the remote computer(s) by sending ICMP (Internet Control Message Protocol)
or RMCP (Remote Management Control Protocol) echo packets to the computer and listening for echo reply packets.
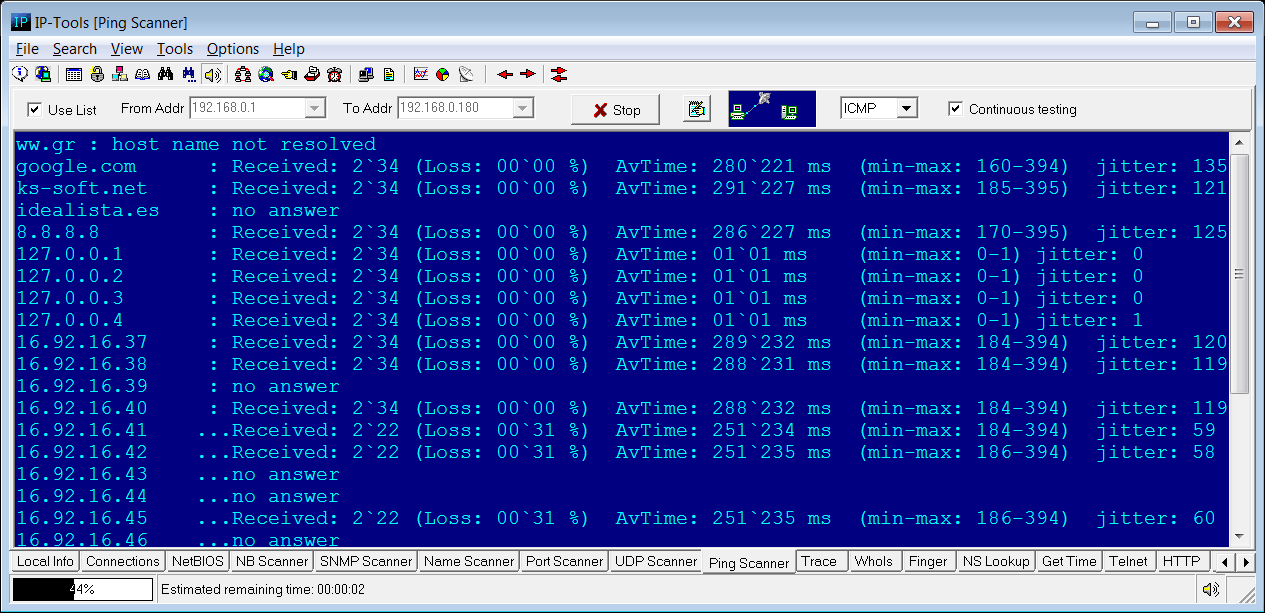
You can ping a single computer, ping computers in a range of IP addresses or ping all computers from the list (ScanList).
You can specify the parameters to ping (such as the packet size, timeout, packets to send, TTL) on the Ping/Trace page in the Options dialog.
RMCP ping
Unlike ICMP ping this mode allows to check powered off servers. Target port can be set in the Options dialog.
Note: not every server supports RMCP and IPMI protocols.
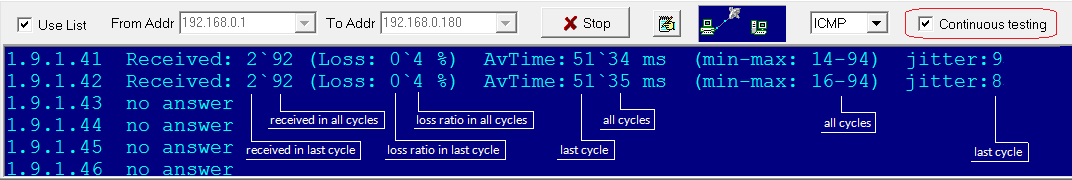
Continuous Testing mode
This option tells IP-Tools to repeat testing again and again until you click Stop button. Scanner collects statistics, shows data related to recent checks
and cummulative counters: number of received packets, loss ratio, average response time, minimum and maximum response time, jitter.
Jitter - amount of variation in response time, calculated by using the following formula: Jitter = SquareRoot( SumOf((ReplyTime[i] - AverageReply)^2) / (ReceivedPacketCount-1) )
Trace the route to a remote host over the network.
This utility allows you to see the route all packets take to go from your machine to a specific host on the Internet (Intranel, LAN).
It also displays the time each hop (or each machine packets go through) takes to answer.
You can specify the parameters to trace (such as the packet size, timeout, packets to send, TTL, and the maximum number of hops) on
the Ping/Trace page in the Options dialog.
How Trace works?
The program determines the route taken to a destination by sending Internet Control Message Protocol (ICMP) echo packets with varying
TTL (Time-To-Live) values to the destination. Each router along the path is required to decrement the TTL on a packet by at least 1 before forwarding
it, so the TTL is effectively a hop count. When the TTL on a packet reaches 0, the router is supposed to send back an ICMP Time Exceeded message to the
source system. Trace determines the route by sending the first echo packet with a TTL of 1 and incrementing the TTL by 1 on each subsequent
transmission until the target responds or the maximum TTL is reached. The route is determined by examining the ICMP Time Exceeded messages sent back
by intermediate routers. Notice that some routers silently drop packets with expired Time-To-Live (TTL) and will be invisible to trace.
The WhoIs utility obtains information about Internet host or domain from the NIC (Network Information Center).
It displays information about the domain name owner, administrative and technical contacts, and other related informations.
IP-Tools has a build-in list of WhoIs servers for all top level domains. You can create your custom list on the
WhoIs page in the Options dialog, and the created items will have priority over the internal list.
You can be part of the community process to build up the WhoIs Server list.
If you send us your custom list, it will be merged with contributions from other users, and an updated list will be sent back to you.
Click the Update button on the WhoIs page in the Options dialog to initiate this process.
Finger displays information about a user (users) on a specified system running the
Finger service. The information provided by the finger server depends on the server's configuration.
This information can include user IDs and user names, home directory, login time,
last time they received mail, and last time they read mail, etc.
Query syntax :
user@host.domain - to retrieve information about a specific user
host.domain - to retrieve information about an entire host.
By default the NS Lookup utility uses Windows API and the default DNS server to
look up a domain names according to its IP address or an IP address from
its domain name. It displays the host name, IP address, alias (if it exists).
You can select "Advanced Name Server Lookup" option to transform this utility into a powerfull network administrator's tool.
In this case you will be able to specify the following:
- DNS server
- port and protocol (TCP, UDP)
- timeout interval and number of retries
- type of request: A, ANY, CNAME, HINFO, MX, NS, PTR, SOA, TXT, SPF or AAAA
- enable or disable recursion
- output mode: Full, Medium, or Compact
- A - IPv4 (IP version 4) address of the host
- NS - authoritative name server
- MD - mail destination
- MF - mail forwarder
- CNAME - canonical name for an alias
- SOA - marks the start of a zone of authority
- MB - mailbox domain name
- MG - mail group member
- MR - mail rename domain name
- WKS - well known service description
- PTR - domain name pointer
- HINFO - host information
- MINFO - mailbox or mail list information
- MX - mail exchange
- TXT - text strings
- SPF - Sender Policy Framework
- AAAA - IPv6 (IP version 6) address of the host
The Get Time utility retrieves time from time-servers and synchronize the timer on a local computer.
IP-Tools may use NTP and Time protocols. You may specify target host with port (e.g. time.nist.gov:123); if you specify port 37,
IP-Tools will use Time protocol (over TCP), if any other port specified or you set hostname without optional port parameter
then NTP protocol will be used (over UDP).
You can use this utility in the manual mode by clicking the Get Time button to take the accurate current time and clicking the Synchronize button to synchronize local timer
or you can use IP-Tools to get and synchronize time in the automatic mode.
For the automatic mode use the following command line parameters:
> ip_tools.exe /SetTime RetriesNumber TimeServer1 [AlternativeTimeServer2 [AlternativeTimeServer3 [...]]
where:
RetriesNumber - maximum number of attempts to connect with the time servers (range: 1..255)
TimeServer1 .. AlternativeTimeServerN - time servers' addresses
IP-Tools will attempt to connect and take time from the TimeServer1.
If the attempt is successful, the program receives the time from the server, sets this time (+GMT) on the local system and terminates.
If the program cannot connect with TimeServer1, it makes an attempt to connect to the AlternativeTimeServer2, etc.
After an unsuccessful connection with the last server in the list, IP-Tools returns to the
TimeServer1. IP-Tools can retry this cycle the maximum RetriesNumber times.
Example :> ip_tools.exe /SetTime 2 192.43.244.18 augean.eleceng.adelaide.edu.au
Telnet client is a terminal emulation program for TCP/IP networks such as the Internet,
which allows you to logon to the computer from a remote location.
You can then enter commands through the Telnet program and the commands will be executed as if you were entering them directly on the server console. This enables you to control the server and communicate with other servers on the network.
This page has two windows. The lower window doesn't translate ESC sequences but
stores all received data and works similar to the log file. The upper window uses the telnet client's
virtual terminal that translates ESC sequences.
HTTP utility allows you to perform HTTP requests and check response from HTTP servers. Why this utility may be useful for you if you already have web browser? There are several reasons:
| 1) | HTTP utility can display full header information (HTTP response code, cookies, name and version of the web server, etc) that the major web browsers neglect to show you when you press "view source". |
| 2) | You can quickly change parameters of the HTTP request (e.g. post data, user name, proxy server, etc) and check your CGI script in different modes. For example you can perform HTTP request using different values of the Agent parameter and check how server responds to different web browsers. |
| 3) | This utility can safely grab just the text portion of a web page without accepting cookies or running any scripts. It will not display any images or popup windows with advertising as well. You can unmark "Display HTTP header and HTML tags" option and take a quick look at text that contains HTML page. |
To start the utility just type URL which you want to check in the "URL" field and click Start button. To change parameters of the HTTP request (such as request method, user name, password, proxy server, etc), select Options item in the popup (or main) menu. Popup menu for HTTP utility contains also following items:
| Save as HTML | - | saves data received in last request (IP-Tools will save completely HTML page regardless of the "Display HTTP header and HTML tags" option) |
| Save as Text | - | saves contents of the output window into a text file |
| Clear | - | clears the output window |
| Copy | - | copies selected text into Clipboard |
| Select All | - | selects all text in the output window |
| Launch browser | - | starts browser installed on your system and opens URL specified in the "URL" field |
The IP-Monitor displays real time graphs of the number of Input, Output, and Error packets for the TCP, UDP, and ICMP protocols.
- TCP In
-
The total number of segments received, including those received in error.
This count includes segments received on currently established connections.
- TCP Out
- The total number of segments sent, including those on current connections but excluding those containing only retransmitted octets.
- UDP In
- The total number of UDP datagrams delivered to UDP users.
- UDP Out
- The total number of UDP datagrams sent from this entity.
- UDP Error
- The total number of received UDP datagrams for which there was no application at the destination port +
the number of received UDP datagrams that could not be delivered for reasons other than the lack of an application at the destination port.
- ICMP In
- The total number of ICMP messages which the entity received (this counter includes all those counted by icmpInErrors).
- ICMP Out
- The total number of ICMP messages which this entity attempted to send (this counter includes all those counted by icmpOutErrors).
- ICMP Error
-
The number of ICMP messages which the entity received but determined as having errors (bad ICMP checksums, bad length, etc.)
+
The number of ICMP messages which this entity did not send due to problems discovered within ICMP such as a lack of buffers. This value
should not include errors discovered outside the ICMP layer such as the inability of IP to route the resultant datagram. In some
implementations there may be no types of error which contribute to this counter's value.
The Host Monitor utility monitors the up/down status of specified hosts. The program verifies connections to
remote computers, routers and other network components by sending ICMP echo packets (pings) to the remote host
and listening for echo reply packets.
For every host you can define the following parameters: hostname (or IP address), comment, test interval, timeout
and the number of retries.
Some notes regarding "Host" property:
Here you should provide the domain name (e. g. www.yahoo.com) or IP address (e. g. 204.71.200.68)
of the host that you wish to monitor. Also you may provide IPv6 addresses (e.g. fe80::370:ff56:fed5:22).
If you type host name, you may specify IP version by choosing one of the following items:
- Default
- IP version 4
- IP version 6
If you choose "Default" IP version, Host Monitor will try to resolve name into IP address using IPv4 protocol. If name cannot be
resolved by IPv4 protocol, utility will try to use IPv6 protocol. If you choose "IP version 4" (or "IP version 6") option,
IP-Tools will use specified protocol only.
Note: IP-Tools supports IPv6 on Windows XP SP2, Windows 2003, Windows Vista and Windows Server 2008 when IPv6 protocol is installed.
On Windows NT 4.0 and Windows 2000 only IPv4 is supported. You may use Local Info -> Winsock utility to check is your system IPv6 ready.
Also, a range of IPv4 addresses (e.g. 10.10.1.100 - 10.10.1.254) rather than a single address can be
specified. In this case, application will create a separate test for each of the addresses within that range.
When status of the host changes, the program can play a sound and write information about the event to the Text or
HTML log file.
Also, for every host you can define 2 commands which will execute external programs. IP-Tools executes these
commands when the host changes status from "dead" to "alive" or from "alive" to "dead".
In the command you can use special variables:
%DateTime% - represents current date and time
%HostName% - represents name of the host that changed status
%HostComment% - returns comment line specified for the host
Directory "SAMPLES\" contains two examples of external programs:
- program "message.exe" displays message dialog (it takes message text from the command line)
- program "sendmail.exe" is a simple mailer, it sends e-mail in automatic mode (you can specify all
parameters for the mail message in command line). More information about SendMail utility available
here
For example you can define a command line like this "samples\sendmail.exe To=admin@firm.com "Subject=%datetime% host %hostname% is Dead" StartAfterLoad"
|
Trap Watcher utility allows you to receive SNMP Trap messages - unsolicited messages from a device (such as router,
server) to an SNMP console. Traps might indicate power-up or link-up/down conditions, temperatures exceeding
certain thresholds, high traffic, etc. Traps provide an immediate notification for an event that otherwise might
only be discovered during occasional polling.
Trap Watcher utility provides you with ability to receive SNMP Trap messages. It displays information about traps,
records information about all or some specific messages into log files, also
launches 3rd party applications in response to every or specified set of SNMP traps, etc.
Trap Watcher displays following information about each trap message:
| • Date | Represents local date and time when message was received |
| • Source host | Represents IP address of the host that have sent the message |
| • Trap type |
Represents type of the trap. It provides information about generic type and enterprise specific number. Generic type could be one of the following: Cold Start, Warm Start, Link Down, Link Up, Auth Failure, EGP Loss, Specific.
|
| • Enterprise | Enterprise field contains an OBJECT IDENTIFIER which names the device that have sent the trap |
| • OID | Variable name (OID) |
| • Value | Variable value |
By clicking on "Date" column header you may change sorting mode for messages; newest messages could appear at the top or bottom of the list.
In the Options dialog you may specify general Trap Watcher settings and provide special instructions for processing of all or some messages. E.g. you may log all messages but send an e-mail only when message from specific device is received. Or you may display all messages on screen but log [Link Down] and [Link Up] messages only.
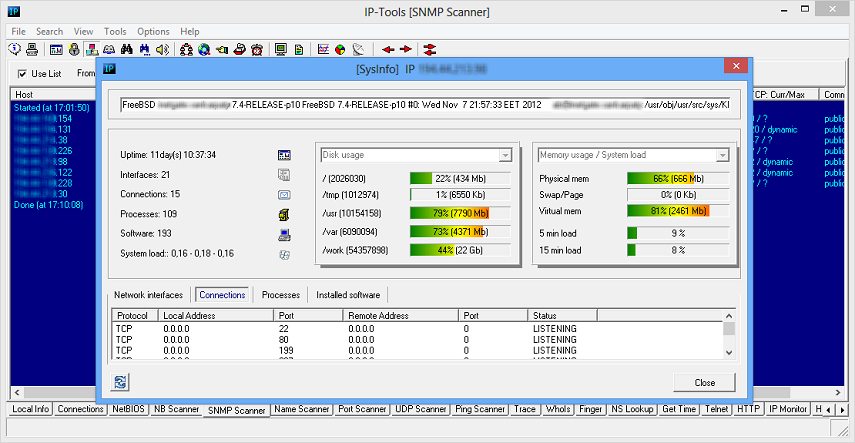
System Info tool uses various protocols to collect data and shows information related to selected remote host.
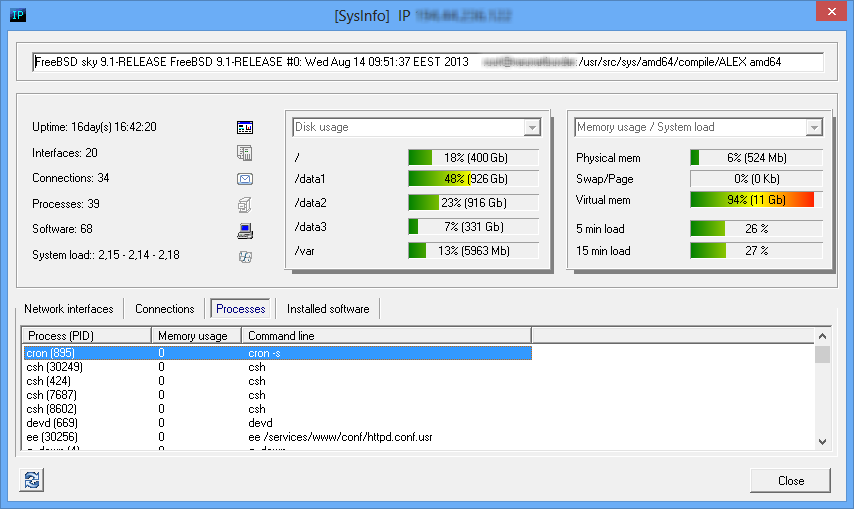
System Info window may show
- system uptime, OS version, build;
- disk, memory usage on Windows systems;
- disk, memory usage and system load on Unix systems;
- memory usage and system load on some Cisco routers;
- network interfaces on various network devices (including Windows and Unix systems, routers, etc);
- opened TCP ports and established TCP connections;
- running processes on Windows and Unix systems;
- installed software on Windows and Unix systems;
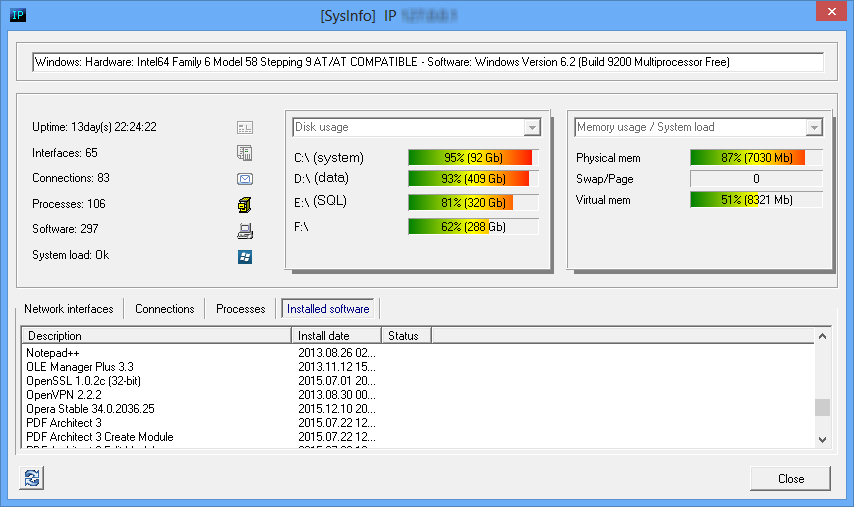
System Info tool can be called from SNMP Scanner tool - just select discovered SNMP enabled host and click on popup menu item "System Info". Also you may use main menu Tools -> System info, in this case you need to provide target hostname or IP address, SNMP protocol version and community string.
Note: SNMP Scanner and System Info tools keep list of discovered devices so you may choose target host from drop down list, in this case SNMP related fields will be set automatically.