|
 |
|
|
| | Novedades |
| | |
|
|
 Mejoras en HostMonitor y RCC Mejoras en HostMonitor y RCC
- Cuando selecciona muchos elementos de prueba y hace clic en el boton Editar, puede cambiar la expresion "Tune up Reply value"; Parametros de Timeout y Retries (numero de paquetes para pruebas de Ping) ademas de otros parametros que podrias modificar antes.
- Elemento del menu emergente "Mark unused" para la lista RMA. Cuando administra la lista de agentes de monitoreo remoto usando el menu LANs -> RMA agents, puede usar un nuevo elemento de menu para atenuar todos los agentes RMA que no se utilizan actualmente.
HostMonitor verifica todas las configuraciones de carpetas, configuraciones de prueba (dentro de la lista de pruebas cargadas), configuraciones de acciones y configuraciones de Network Discovery .
- Mejoras menores de rendimiento
 Se resolvio el siguiente problema
- HostMonitor v 14.24 podria resolver la variable %FullPath% incorrectamente. Fijado
|
|
|
Mejoras y correcciones de HostMonitor
- Metodo de prueba de Shell Script: un error poco comun de Windows puede causar problemas con el metodo de prueba de Shell Script,
por lo que cambiamos el codigo de HostMonitor.
Nota: si necesita utilizar algunos procesadores de secuencias de comandos muy antiguos (como el programa MS DOS en Windows XP), la nueva version no funcionara
a menos que cambie el codigo de HostMonitor al modo antiguo: agregue ScriptsShortName=1 linea en la seccion [Misc] del archivo
hostmon.ini y reinicie HostMonitor
- Metodo de prueba HTTP: cambios menores
- Acciones: las variables %uuu% y %uuu[-0u]% se pueden utilizar como parametros de las acciones:
%uuu% - hora local actual como UnixTimeStamp (segundos desde 1970)
%uuu[-0u]% - hora UTC actual como UnixTimeStamp (segundos desde 1970)
- Accion de HTTP request: el parametro Content-Length se podria calcular incorrectamente para solicitudes POST grandes. Fijado
- Accion Send E-Mail: correcciones relacionadas con el juego de caracteres Big-5
|
|
|
Mejoras relacionadas con IPMI
Las siguientes aplicaciones admiten mas modos de cifrado para pruebas relacionadas con IPMI: IPMI Health, IPMI Temperature, IPMI Fans, IPMI Voltage, IPMI Current, IPMI Discrete Sensor
- HostMonitor
- Passive RMA for Windows
- Active RMA for Windows
- Active RMA for FreeBSD
- Active RMA for Linux
- IPMI Browser
Se admiten los siguientes modos de cipher
- 00: None
- 01: RAKP-HMAC-SHA1
- 02: RAKP-HMAC-SHA1 + HMAC-SHA1-96
- 03: RAKP-HMAC-SHA1 + AES128CBC + HMAC-SHA1-96
- 15: RAKP-HMAC-SHA256
- 16: RAKP-HMAC-SHA256 + HMAC-SHA256-128
- 17: RAKP-HMAC-SHA256 + AES128CBC + HMAC-SHA256-128
Mejoras en la GUI de HostMonitor y RCC
- Puede buscar una carpeta por nombre o campo de comentario usando el menu Search o la tecla de acceso rapido Ctrl+Shift+F
- Mejoras en el "Log Viewer"
 HostMonitor x64
Ahora podemos ofrecer la version x64 de HostMonitor. No esta disponible para todos y no todos lo necesitan, para la mayoria de los clientes, la version x86 (32 bits)
funciona de manera mas eficiente y usa menos memoria.
Por otro lado, si tiene mas de 100 000 elementos de prueba mas muchos operadores RCC remotos y mas de 1000 agentes RMA activos conectados a HostMonitor,
es posible que necesite la version x64. Puede usar mas de 2 GB de memoria y, en algunos casos, funciona mas rapido.
Hilo de foro relacionado
Si desea probarlo, comuniquese con el equipo de soporte por correo electronico (menu de HostMonitor Help -> Support)
|
|
|
HostMonitor, RCC, RMA pasivo y activo para Windows (x86 y x64):
mejoras relacionadas con el metodo de prueba Traffic Monitor y la ventana "Choose network interface" (esta ventana tambien se usa para el metodo de prueba Interface Status)
- Opcion "Request and calculate traffic data". Si habilita esta opcion, HostMonitor mostrara informacion adicional para cada interfaz de red:
- cantidad de trafico total recibido y transmitido;
- cantidad promedio de datos por segundo;
- utilizacion del ancho de banda (%);
- uso del ancho de banda por trafico entrante;
- uso de ancho de banda por trafico saliente
Notas:
- Utilizacion del ancho de banda: cantidad de datos transferidos a traves de una red en relacion con su capacidad total.
- En este caso, el trafico promedio y el porcentaje de utilizacion se calculan en funcion del trafico total a traves de la interfaz desde que se reinicia el dispositivo (no se mide la utilizacion actual del ultimo segundo o minuto)
- Esta opcion esta disponible para dispositivos habilitados para SNMP v2c, SNMP v3 con contadores de trafico de 64 bits
- Puede ordenar las interfaces en la lista por cualquier campo (indice, descripcion, velocidad, trafico, etc.)
- Cuando esta creando un nuevo elemento de prueba, puede seleccionar muchas interfaces en la lista; HostMonitor creara
un elemento de prueba separado para cada interfaz seleccionada. Como antes, tambien puede seleccionar el elemento "monitor traffic on all interfaces",
este unico elemento de prueba controlara todas las interfaces y verificara el trafico total en el dispositivo.
- Otras mejoras menores de la GUI
Mejoras en Active RMA para Linux y RMA para FreeBSD
- Nuevo modulo de cifrado mas rapido
- El agente puede proporcionar datos relacionados con el trafico para la ventana "Network interfaces"
- File Integrity prueba funciona mas rapido en todos los modos: CRC32, MD5, SHA256, SHA512
- Text Log prueba: algunas mejoras de velocidad relacionadas con el modo de "expresiones"
- SNMP Trap prueba: mejoras en la velocidad. Algunos clientes configuran miles de elementos de trampa SNMP con varios filtros,
en tal caso, el procesamiento de muchos mensajes de trampa puede generar una alta carga de CPU y ralentizar el agente RMA (especialmente cuando se usan las
opciones de "counter fits expression", miles de elementos con dicha opcion pueden ralentizar bajar incluso esta nueva version del software)
Mejoras en WatchDog para Linux y WatchDog para FreeBSD
- Nuevo modulo de cifrado mas rapido (requerido para HostMonitor 14.00)
|
|
|
Mejoras menores relacionadas con
- Send E-Mail action
- Telegram message action
- Log Viewer
- Web Service
|
|
|
HostMonitor and RMA for Windows: se mejoraron 26 metodos de prueba
Las siguientes pruebas son compatibles con TLS 1.3
- URL
- Certificate Expiration
- POP3, IMAP
- E-mail, Mail Relay
- LDAP
- FTPS
- HP iLO tests: Health, Temperature, Fans, Power, Disk status
- Pruebas relacionadas con VMWare host: Host status, CPU Usage, Free Memory, Datastore Space
- Pruebas relacionadas con sistemas virtuales VMware: Guest status, CPU Usage, Free Memory, Free disk space
Notas:
- La prueba de caducidad del certificado (Certificate Expiration test) es compatible con TLS 1.3 en Windows 7 y posteriores.
- Otras pruebas requieren Windows 11 o Windows Server 2022 (solo para TLS 1.3).
- De manera predeterminada, solo estan habilitados los protocolos TLS 1.1, 1.2 y 1.3 (TLS 1.1 y 1.2 en sistemas Windows mas antiguos)
- Si necesita verificar algun servidor HP muy antiguo (iLO2), puede habilitar TLS 1.0 usando la opcion hostmon.ini: agregue la linea sslProto_HPiLO=10880 en la seccion [Misc] del archivo hostmon.ini y reinicie HostMonitor
- Si necesita verificar algun sistema VMWare muy antiguo (ESXi 5.0 o anterior), puede habilitar TLS 1.0 usando la opcion hostmon.ini: agregue la linea sslProto_VMWare=10880 en la seccion [Misc] del archivo hostmon.ini y reinicie HostMonitor
- Opciones similares disponibles para POP3, IMAP, LDAP, FTPS, EMail, Mail Relay, pruebas de URL
Seccion [Misc]
sslProtocols: establece las opciones de TLS predeterminadas para todos los metodos, incluida pruebas de URL;
las siguientes opciones pueden anular los modos TLS para metodos de prueba especificos:
sslProto_POP3
sslProto_LDAP
sslProto_IMAP
sslProto_FTPS
sslProto_HPiLO
sslProto_VMWare |
= 8192 - just TLS 1.3
= 10240 - TLS 1.2 and 1.3
= 10752 - TLS 1.1, 1.2, 1.3
= 10880 - TLS 1.0-1.3 |
Pruebas SSH y SFTP:
- admite los algoritmos de intercambio de claves keDHGroup16Sha512, keDHGroup18Sha512 y keDHGroup14Sha256
- admite los algoritmos HMAC hmac-sha2-256-etm@openssh.com y hmac-sha2-512-etm@openssh.com
File Integrity prueba
- funciona mas rapido en todos los modos: CRC32, MD5, Sha256, Sha512
Shell Script prueba
- algunas mejoras de velocidad (si el script genera una salida grande antes del resultado de la prueba)
- soporte Unicode para archivos de salida. Los scripts de Powershell pueden producir resultados en dicho formato (el archivo debe comenzar con bytes FFFE BOM)
SNMP Trap prueba
- mejoras de velocidad. Algunos clientes configuran miles de elementos de trampa SNMP con varios filtros, en tal caso, el procesamiento de muchos
mensajes de trampa puede generar una alta carga de CPU y ralentizar HostMonitor (especialmente cuando se usan las opciones de "counter fits expression")
HostMonitor: acciones mejoradas
- La accion "Send E-mail" es compatible con TLS 1.3
- La accion "Send message to pager over SNPP" es compatible con TLS 1.2
(se requiere Windows 7 o posterior)
Actuacion
Codigo de compresion mas rapido para el intercambio de datos entre HostMonitor y RCC, HostMonitor y Web Service
Codigo de cifrado mas rapido para el intercambio de datos entre todos los componentes
- HostMonitor ↔ Passive y Active RMA
- HostMonitor ↔ RCC
- HostMonitor ↔ Telnet client
- HostMonitor ↔ Web Service
- HostMonitor ↔ WatchDog
- RMA Manager ↔ Passive y Active RMA
Nota 1: para la transmision de datos entre HostMonitor y Passive RMA, se utiliza el codigo antiguo de forma predeterminada. Si no esta utilizando agentes RMA antiguos para UNIX, tambien puede cambiar este modulo a un codigo mas rapido: agregue la linea Encr3PassiveRMA=1 en la seccion [HostMon] del archivo hostmon.ini y reinicie HostMonitor.
Nota 2: si un solo RMA tiene que realizar muchas pruebas (por ejemplo, 100 pruebas/seg), entonces es mejor usar Active RMA. Por otro lado, si tiene que usar muchos agentes (por ejemplo, 500 RMA) con poca carga en cada agente, entonces es mejor usar Passive RMA.
Mejoras en la GUI de HostMonitor y RCC:
- En algunas condiciones, la desactivacion, la pausa o la reanudacion de miles (por ejemplo, 20 000) elementos de prueba podrian ser lentos; las nuevas versiones funcionan mucho mas rapido
- En algunas condiciones, la operacion de eliminacion de carpetas con miles de subcarpetas podria ser lenta en el lado de RCC; la nueva version funciona mucho mas rapido
- Algunas mejoras de velocidad relacionadas con las vistas (se realizaran mas mejoras en las versiones futuras)
- Top Hosts pane: mejor soporte para numeros grandes en el campo Responder (hasta 10 ^ 36) y numeros pequenos (entre 0 y 1)
- Mejoras menores en las herramientas de auditoria
- Correcciones menores de GUI
RMA Manager
- importacion mas rapida desde archivos csv
- se muestran las estadisticas de importacion y la barra de progreso
- filtro de registro de importacion: modos "Just errors" y "All data"
WebService
- TLS 1.3 compatible en modo HTTPS
(ahora se requiere Windows 7, Windows Server 2008 o mas reciente para el modo HTTPS; el modo HTTP se puede usar en Windows XP, Windows Server 2003 o cualquier sistema operativo mas nuevo)
|
|
|
Mejoras en el rendimiento de HostMonitor y RCC
Si esta utilizando HostMonitor con Remote Control Console (RCC) conectadas y se carga una gran lista de pruebas (mas de 100,000 elementos de prueba),
algunas operaciones masivas realizadas por el cliente Telnet, HM Script, HostMonitor o la GUI de RCC podrian ser demasiado lentas.
P.ej.
- La operacion de deshabilitacion para 20,000 elementos de prueba podria ser lenta si el "User operations log" esta habilitado (por ejemplo, el comando telnet "DisableAll -r")
- La operacion de pausa para 30,000 elementos de prueba podria ser muy lenta si HostMonitor se iniciara como aplicacion y la opcion "Change tray icon when a host dies" esta habilitada (por ejemplo, el comando HM Script "PauseTest _AllPing 15 -r")
- Restablecer estadisticas para 100,000 elementos de prueba
- Vincule 10,000 elementos de prueba a otra carpeta
- Mover elementos de prueba a otra carpeta
- Renombrar carpeta
La nueva version funciona significativamente mas rapido en tales casos
Mejoras de rendimiento relacionadas con el procedimiento "Import from text file". Podria ser demasiado lento si esta utilizando mas de 100,000 elementos
de prueba e importando miles de elementos.
Algunas mejoras de rendimiento relacionadas con la supervision
Otros
- HostMonitor, RCC, Log Analyzer y Log Visualizer admiten numeros grandes en el campo Reply (Responder), hasta 10^36
(el limite anterior era 2^63, aproximadamente 10^18). Los numeros mas grandes se consideran una cadena y no se calculan para las estadisticas.
- HostMonitor evita que el registro de operaciones del usuario crezca demasiado rapido, p. no agregara 200,000 registros
cuando el usuario deshabilite/pause/elimine tantos elementos de prueba. Las nuevas opciones "no documentadas" de hostmon.ini le permiten establecer limites
para el numero de registros para una operacion. Puede agregar lineas MaxLimitSet y MinLimitSet en la seccion [UserLog] del archivo hostmon.ini y reiniciar HostMonitor.
P.ej.
MaxLimitSet=700
MinLimitSet=99
le dice a HostMonitor que agregue hasta 700 registros (MaxLimitSet) para una operacion (por ejemplo, elimine 700 elementos de prueba).
Si alguna operacion modificara mas de 700 elementos, entonces HostMonitor agregara solo 99 registros (MinLimitSet), mas un registro con
itemID establecido en -1 y un mensaje como "too many items, some log records skipped. Total 99882 items processed"
- Otras mejoras menores de HostMonitor y RCC
|
|
|
HostMonitor and RCC: Connection Manager GUI improvements:
- Export to CSV file
- Import from CSV file
- Added "comment" field so you may put any notice there
- Find/Search_again popup menu items (Ctrl+F, F3). Note: application may check for IP address within IP range, e.g. it may find "10.10.5.55" in records like "10.10.5.11-10.10.5.99"
- You may sort items by agent, resource, login or comment
- Icon images mark new and modified records
- Connection Manager window opens faster (you may notice difference if there are over 1000 items in the list; e.g. when you need to monitor a lot of systems that do not belong to Windows domain and you need to use different account or password on each non-domain system)
- Other minor GUI improvements
HostMonitor and RCC: Connection Manager LAPS related options:
- The Local Administrator Password Solution (LAPS) provides management of local account passwords of domain joined computers. Passwords are stored in
Active Directory (AD) and protected by ACL. Connection Manager may retrieve up to date local administrator passwords from Active Directory and update records in HostMonitor database.
- By default "administrator" account name is used; if you set LAPS for other account (using LAPS GPO policy), change account name on HostMonitor side as well
using Connection Manager popup menu LAPS -> Set default account name.
- You may update password for single selected item using menu LAPS -> Update password for selected item
- You may update passwords for all items using menu LAPS -> Update passwords for ALL administrator accounts (please check Note1 and Note2)
- Note 1: Remote Monitoring Agents do not support LAPS options yet. So Connection Manager may update records related to hosts within local HostMonitor/RCC domain
- Note 2: domain/server field of the record should point to specific server, default account (*) and accounts for IP ranges are not updated
- Note 3: Microsoft LAPS modules should be installed on system where HostMonitor (and/or RCC) is running
https://www.microsoft.com/en-us/download/details.aspx?id=46899
- Note 4: in order to get passwords using LAPS HostMonitor/RCC account requires "All extended rights" permission. Please make sure regular users, groups or computer
objects do not own this permission. To restrict the ability to view the password to specific users and groups you need to remove "All extended rights" from users and groups that are not allowed
reading the value of attribute ms-Mcs-AdmPwd. This is important because the "All Extended rights" permission gives permission to read confidential attributes.
- We can redesign Connection Manager, HostMonitor and Remote Monitoring Agents will work with LAPS more efficiently
and you will need to create just one record for entire LAN. Do you use LAPS? Do you needs such options? Please contact us (e-mail to support@ks-soft.net).
Priority of this task depends on feedback from you.
HostMonitor and RCC: Test Properties window offers new popup menu items:
- Copy host to clipboard (Ctrl+H)
- Resolve host to IP and copy (Ctrl+I)
- Copy host and IP
- Find record for this host in Connection Manager (Ctrl+Q)
Application checks for appropriate record based on agent, host, and test method. Records for specific host and agent are prioritized; then application checks for records with agent set to
"any", for records with IP range; etc. If only default (*) record found or no matched records found, HostMonitor offers to create a new record
HostMonitor and RMA actions:
- Stop Service, Start Service, Restart Service actions may use Connection Manager when "Connect As" option is not used
Web Service interface:
- Top Hosts pane offers the following options:
- Show Collapsed / Hide Collapsed
- Automatically open&close panels / Manually open&close panels
Using these options and drag&drop operations, you may organize panels to your liking. For example you may set Show Collapsed + Manually open&close panels options,
move Web related groups to the top, move UPS related groups to the bottom, minimize(close) HDD related groups, then switch from Show Collapsed to Hide Collapsed.
While "Automatically open&close panels" option tells Web Service to open groups with data (tests) and minimize or hide groups without available tests.
|
|
|
HostMonitor/RCC GUI improvements
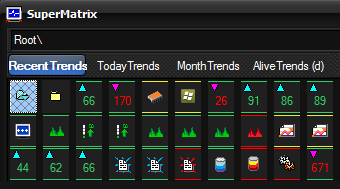
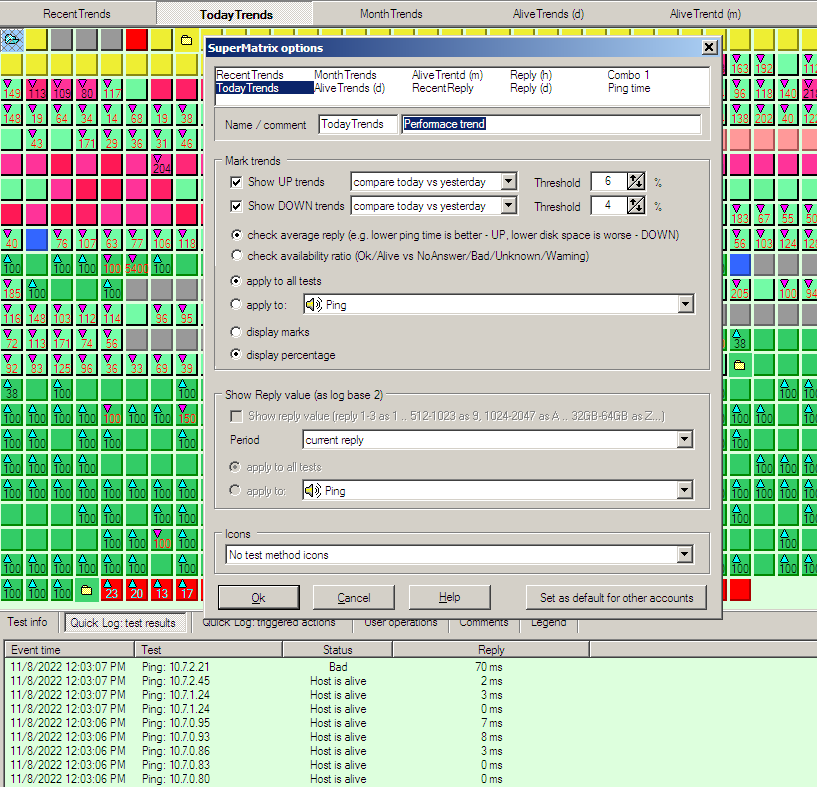
SuperMatrix: more visualization options
SuperMatrix window may provide additional information for each test item
- up and/or down trends based on average reply value of the tests items. HostMonitor may check and compare several time intervals:
- compare this and last hour
- compare today and yesterday
- compare this and last month
- up and/or down trends based on availability ratio of the tests items (good/bad status ratio). HostMonitor may check and compare several time intervals:
- compare this and last hour
- compare today and yesterday
- compare this and last month
- display reply value as log base 2
- current reply
- hourly average
- daily average
- monthly average
- display test method icon for each test item; display icons just for bad/unknown/warning test items; display icons for specific test method
You may mark two or all three options, in this case "trends" option will be prioritized and lowest priority will be set to "icons" option.
So reply marks will be displayed when trend does not reach specified limit and icons will be displayed when test reply value is empty
(or reply option is set for another test method).
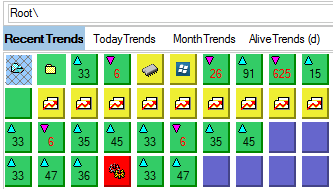
SuperMatrix profiles
You may setup 10 profiles and switch between profiles with one click.
For example you may
- use one profile in order to display up and down trends for Ping tests based on average reply values gathered today and yesterday with 10% up-threshold and 5% down-threshold
- use another profile in order to display up and down trends for all tests based on availability ratio of this and last month with 5% up-threshold and 2% down-threshold
- 3rd profile: display current reply for CPU Usage tests and show icons for other test methods
Each operator may set its own profiles. Also admin may setup default profiles for all operators
that did not set personal profiles yet ("admin" in this case operator with "edit GUI options for all accounts" permission)
SuperMatrix: quick switch
Also you may temporarily override profile settings and display just trends or reply value or icons for ALL test methods. You may use
popup menu items or hot keys: Ctrl+E (show icons); Ctrl+R (show reply values); Ctrl+T (show trends). HostMonitor will use limits and
time period specified for current profile but will apply selected option for all items (even if the profile set to show trends just for
memory test, for example); also it will display icons regardless of test status and size of the cells.
You may press the same hot key (or use the same menu item) in order to deactivate "quick switch" mode and activate profile settings again.
Or just switch to another profile when needed.
SuperMatrix: current color palette
This option turns off bright green-yellow-red cells colors and tells SuperMatrix window to use current palette.
Also "icons" mode works differently in this case, images will be selected based on test method AND test status.
RMA agents list
- Works fater with large lists
- Added "find" (Ctrl+F) and "search again" (F3) options
New variables
- %AccountSet% variable returns username set for the test item (including URL, HTTP, OPC, SOAP, Mail Relay, Apache, NGINX, Tomcat, POP3, IMAP tests)
- %uuu% variable returns UnixTimeStamp (seconds since 1970)
- new options for date expressions: [-0u] converts local time to UTC time. E.g. %yyyymmdd-hhnn[-0u]% %uuu[-0u]%
The following issues were resolved
- HostMonitor and RMA for Windows: NT Event Log test method could use a lot of memory when thousand of new records fit filters and "report about all good/bad events" option is used. Fixed
- Web Service: web interface in some cases did not ask for login after logout operation (new browser session was required for new login). Fixed
|
|
|
HostMonitor improvements
- When you set a lot of test items with private log files (e.g. 20,000 unique log files) and Windows Defender is active,
then the antivirus may significantly slow down HostMonitor. The new version works much faster in such cases and the load on the system caused by
the antivirus software is reduced.
However we still recommend excluding log and report files from the antivirus check.
- New "undocumented" hostmon.ini options allow you to set logging pools size (pool for common log and pool for all private logs)
You may add one or two lines in [Logging] section of hostmon.ini file and restart HostMonitor. E.g.
CommonPoolSize=40960
PrivatePoolSize=10240
Note: the minimum size of each pool: 4096
The following issues were resolved
- HostMonitor: some corrections related to %TrapAllValues_NameValue% and %TrapAllValues_NameValueShort% variables
- Web Service: in some cases web interface could translate user comments using lowercase letters for all words (e.g. when operator disables test item). Fixed
- Web Service: acknowledge operation could save only 1st line of the comment. Fixed
|
|
|
HostMonitor improvements
- Advanced mode action and variables like %AckRecurrences%, %AckComment%, etc
allow starting special actions when Bad test status was acknowledged by the operator. Such actions could be
started after the following test probes while sometimes you may need to start action right after acknowledgment.
Yes, you can force HostMonitor to perform any test right now and this will trigger action execution (according
to the expression) however some improvements can be done. So we added new useful option: if you set advanced
mode action using %AcknowledgedJustNow% variable, then HostMonitor may trigger action when operator acknowledges
test status without waiting for the next test probe. This way you may pause or disable test (if you need) right
after acknowledgement and still trigger special action(s).
For example, you may use expressions like
%AcknowledgedJustNow% and ("%Reply%" > "90 %")
%AcknowledgedJustNow% and (("%AckComment%" getword 1)=="Attention")
Note: HostMonitor may trigger such action even if operator chooses "acknowledge and STOP alerts" option;
"New ack comment" operation may trigger such alerts as well.
GUI improvements
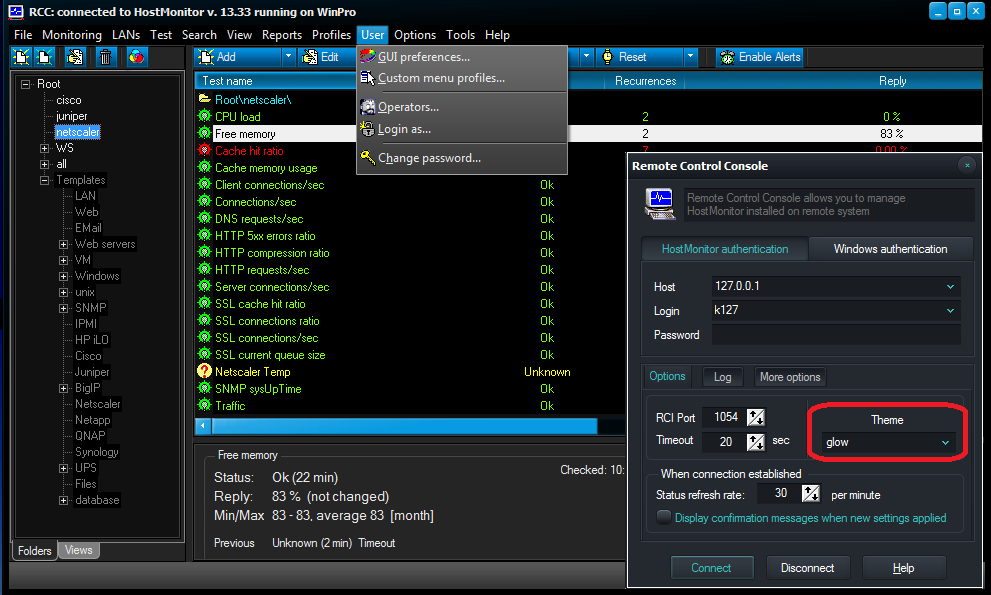
- Experimental RCC_Theme application - Remote Control Console with themes support.
You may choose various dark and light themes: black, glossy, grey, glow, onyx, light, silver, saphire, win10, etc.
What is the difference between color profiles and themes? Color profiles allow customization of test item colors
(depending on test status) for GUI, HTML reports and log files while using Themes you may change application look: window title, menus, buttons, controls and so on.
When non-default theme set then you may adjust just font color for various test items (Bad, Ok, Unknown, Warning, etc); you cannot change background color in this mode.
- Various HostMonitor/RCC GUI improvements
The following issue was resolved
- In some cases SLA reports with charts could fail (since v 13.00). Fixed
|
|
|
HostMonitor improvements
- Minor optimization
- Modified TestInfo window
- Modified Info pane shows status duration, rise or drop of test result like "512 GB (-20 GB)", previous status, previous reply, min, max and average reply
for several periods [this hour / today / yesterday / this month / since reset]
- New dynamic icons for "Icon" mode...
|
|
|
HostMonitor improvements
- Redesigned mailer allows to send more e-mails using less resources.
However we recommend to use Master-Dependent test relations, this way some general network failure
will not lead to thousand actions triggered at once
- Better protection from DDoS attacks on TCP port used for communication with Active RMA agents.
However we still recommend to use firewall or HostMonitor filters (Options dialog -> Active RMA server ->
Accept connections from the following IP addresses)
- Optimized built-in server for Active RMA agents works about 10% faster
|
|
|
HostMonitor and RMA for Windows
- new test methods
- SonicWall CPU usage
- SonicWall Memory usage
HostMonitor and RMA for Windows
Web Service
- supports Views based on logical expressions.
The following 84 variables supported (other variables offered by HostMonitor and RCC GUI not supported by Web Service)
The following issue resolved
- %FolderCurrent_TotalTests% and %FolderRecursive_TotalTests% variables could return 0. Fixed
|
|
|
URL test improvements
- "Download nested frames" option checks if src parameter of the frame/iframe tag set to "about:blank" and there is "data-lazy-src" option.
In such case HostMonitor checks URL specified in "data-lazy-src" parameter (there is no such parameter in HTML specifications but its
often used by JS code)
SSH test allows you to check result of the command execution in 4 different ways:
- Exit code - checks exit code (error level) returned by the program. Reply field shows exit code
- Text (show code) - checks for specific strings or expression in the command output. Reply field shows exit code (error level)
- Shell script result - checks the command output for specially formatted result string
- Text output - checks for specific strings or expression in the command output, Reply field shows command output
File/Folder Availability test
- %object2% variable provides target path (path without file name)
Several minor issues related to detailed historical charts were resolved
|
|
|
Web Service: new authentication methods
HostMonitor authentication
Web browser will prompt for user name and password, operator should type user name and password set on HostMonitor side (menu User -> Operators).
Traffic between browser and Web Service is not secured (unless HTTPS is used). Traffic between Web Service and HostMonitor are secured (just like HostMonitor<->RCC or HostMonitor<->RMA traffic).
Windows or HostMonitor authentication (priority: Windows authentication)
If remote operator logged on to the domain, web browser will try to get access to Web Service using Windows authentication mechanism (Kerberos).
HostMonitor user account with the same name should be set with "HM or Windows authentication" option
and both HostMonitor and WebService processes should be started on the same system (domain member).
Otherwise browser will prompt for user name and password and HostMonitor authentication will be used.
HostMonitor or Windows authentication (priority: HostMonitor authentication)
Web browser will prompt for user name and password. However If remote operator logged on to the domain and HostMonitor user account with the same name set with
"HM or Windows authentication" option and both HostMonitor and WebService processes are running on the same system (domain member) then you can type
WindowsAuth instead of user name and web browser will be able to connect to HostMonitor using Windows authentication mechanism (Kerberos).
You may set allowed authentication mode using Web Service menu Options -> Authentication
See also Kerberos notes and browser settings
|
|
|
HostMonitor improvement
- Optimization, about 5% better performance on high load
|
|
|
HostMonitor improvements
- Sometimes antivirus (e.g. Windows Defender) may use a lot of system resources during checking of HostMonitor's "system" and "user operations" log files (especially when HTML file format is used).
We modified logging module, this helps to reduce system load caused by antivirus software. However we still recommend to exclude log and report
files from the antivirus check.
The following issues were resolved
- Built-in backup tool: sometimes HostMonitor could remove recent backup copies instead of oldest copies. Fixed
- Minor historical charts corrections
- Minor RCC corrections
|
|
|
HostMonitor and RCC improvements
Historical charts improvements
(Test History, Network map, Super matrix, Sysinfo windows)
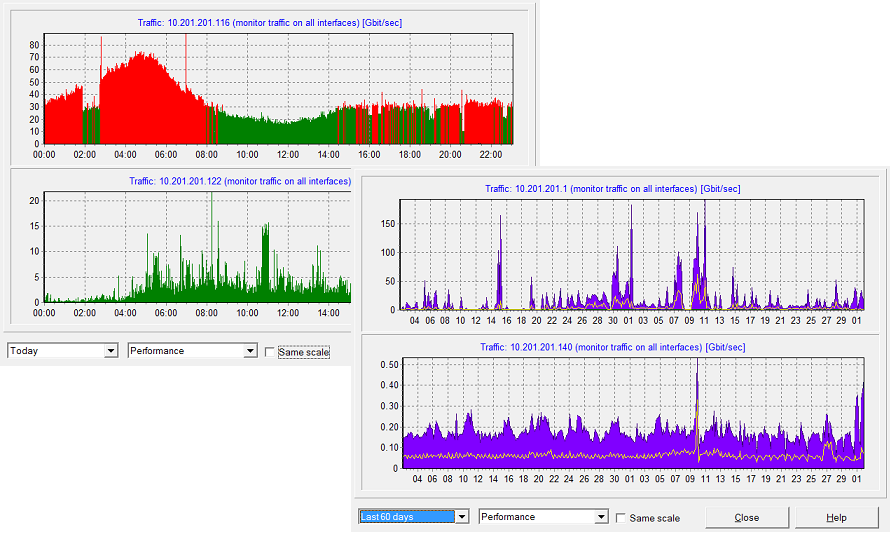
1) Detailed mode for Performance charts
History-related windows may display charts using 2 modes:
- brief (works without log files, supported since version 8)
- detailed (new mode, requires new kind of logs: compact logs)
HostMonitor automatically chooses detailed or brief mode for charts. If you just installed HostMonitor version 13, there are no data yet so Brief
mode will be used. After 5-10 minutes HostMonitor may switch to Detailed mode for some time intervals (Today; Last 24 hours). In couple days
HostMonitor may enable Detailed mode for [Yesterday], [Last 48 Hours], [Last 7 days], [Last 14 days] time intervals. And finally Detailed mode
will be enabled for [This month], [Last 30 days], [Last moth], [Last 60 days] intervals.
Note #1: [This year], [Last year], [Last 12 months], [Last 24 months] - only brief mode supported for such time intervals.
Note #2: If you disable compact logs, only brief mode will be used.
|  |
| brief | detailed |
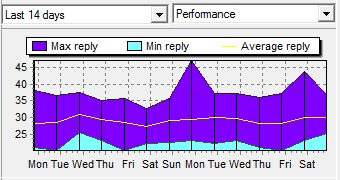
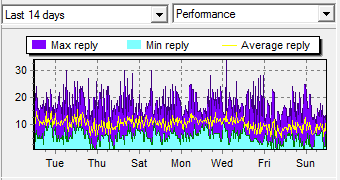
Test History window improvements
2) RCC (Remote Control Console) may show time offset in History window title (when time on HostMonitor system is different from RCC time)
3) Zoom/Unzoom operations adjust time labels. Various formats can be set depending on selected time interval:
- day of the month
- day of the week (day of the month)
- day of the week
- day of the week hh:mm
- hh:mm
- hh:mm:ss
(note: you may zoom in chart when single test item selected)
4) Charts can be updated by timer so you may keep Test History window open and you will see updates. Refresh rate depends on selected
time interval: 5min for daily charts; 1 hour interval for weekly charts; 2 hours interval for monthly charts.
5) New popup menu items tells HostMonitor to copy raw data from chart into clipboard
- Copy to CSV
- Copy to CSV all tests (available when several tests displayed)
6) New popup menu item: Show min values -> Auto, On, Off modes
7) If you open Test History window for 2 or 3 selected test items, charts will be located one below another.
Horizontal mode allows to see more details on the charts
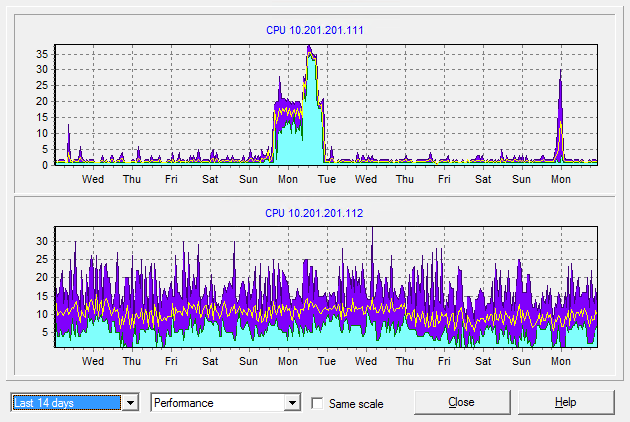
8) "Same scale for all" option was replaced with "same scale for groups", it sets the same scale for groups of selected tests. For example:
- if you select CPU Usage and Drive Free Space test and open Test History window, then HostMonitor will use one scale for CPU tests and another scale for drive free space tests
- if you open Test History window for Drive Free Space tests some of which use GB units while others display percent of free space, then
HostMonitor will use one scale for tests with "%" units, other scale for tests with "GB" units
- if you open such window for CPU Usage, Ping, Trace and Traffic Monitor test items, then HostMonitor will use one scale for Traffic Monitor
tests, another scale for CPU+Ping+Trace test items
9) Other minor improvements
Compact logs
If you are using Brief or Midnight mode for Primary/Backup log files while you need detailed historical charts (Test History, SysInfo,
SuperMatrix, NetMap windows), you may enable Compact logs. HostMonitor will store extra data in specified folder, keep results related
to last 2 months and remove older data.
If you are using Full logging mode for Primary log file, you still may like detailed charts because HostMonitor charts can be displayed
within 1 second while Log Analyzer may need a minute in order to parse large log files.
Disk space requirements
If you set 100,000 test items and HostMonitor performs over 1,000 tests per second, such data files may consume about 10GB of disk space.
If you set just 5,000 test items and perform 50 tests/sec, then data files will consume about 500MB of disk space.
See Options dialog -> Log settings -> Compact logs page
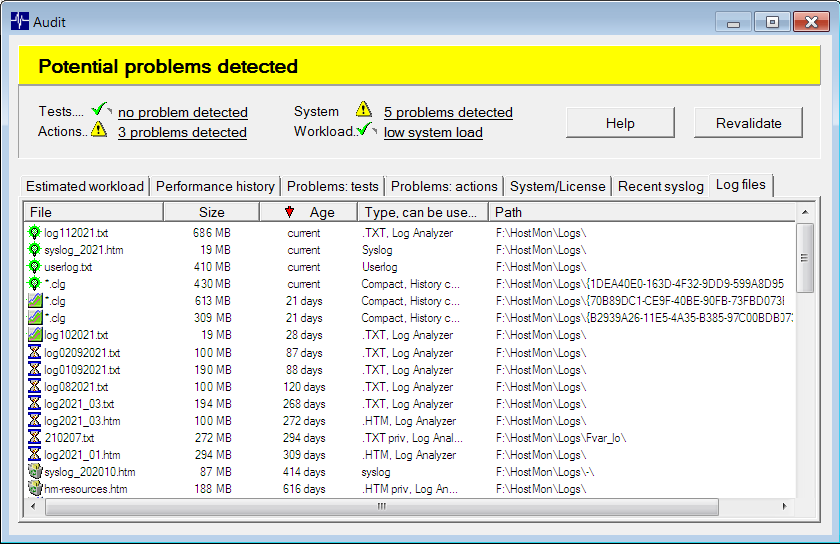
Auditing Tool improvements
Log Files page
Some customers have just 2-3 log files - one log file with test results (common log), single system log file and user operations log.
Other customers may have thousand log files:
- common log file(s) with test results, changed monthly, weekly or daily
- private log files for 30,000 test items (each of 30,000 logs can be changed on regular basis as well if you are using file name like %TestID%-%yyyymmdd%.log)
- system log files (can be changed on regular basis as well)
- user operation logs
- compact log files
There are log processing options but some customers do not setup HostMonitor to remove old log files automatically and keep 500,000 forgotten log files.
Auditing Tool finds and displays all log files in a single table. It shows file name, size, age, type of the log and location. In some cases it
shows summary - single record with size of all *.txt or *.clg files in the folder.
You may sort items by any field (e.g. name, size, age) and use popup menu items in order to remove unnecessary files.
Various GUI improvements related to the following windows
- Mail Profiles
- Action Profiles
- Report Profiles
- Recent Events
- Auditing Tool
- SNMP Credentials
Minor performance improvements
HTTP Request action: you can add hmvars: text HTTP header into HTTP/HTTPS request. In this case
HostMonitor will not encode variable values, will not apply JSON or HTML encoding rules
The following issue was resolved
- E-mail test method: under some conditions HostMonitor could repeat test again and again every second. Fixed
|
| |
Archive (English):
versions 12.00 - 12.98
versions 11.00 - 11.98
versions 10.00 - 10.70
versions 9.00 - 9.90

Copyright (c) 2000-2023 by Advanced Network Software. All Rights Reserved
| |