|

|
Log Analyzer is an auxiliary application for HostMonitor, it is included into Advanced Host Monitor package.
Professional, Advanced and Enterprise licenses for Advanced Host Monitor include a license for Log Analyzer. Starter license holders may order Log Analyzer separately. |
 Intro
ODBC logs
Full screen chart
Report Manager
Options
Scripts
System Requirements
Price Intro
ODBC logs
Full screen chart
Report Manager
Options
Scripts
System Requirements
Price
 As you know HostMonitor is able to log test results into a log file.
Log Analyzer is a graphical tool that visualizes the log data.
It parses the contents of a log file and presents the data as a variety of charts representing different test statistics.
Log Analyzer may analyze all types of log files: HTML, Text, and DBF log files.
In a second, administrator can get a snap shot of the host performance over a period of days or even months.
As you know HostMonitor is able to log test results into a log file.
Log Analyzer is a graphical tool that visualizes the log data.
It parses the contents of a log file and presents the data as a variety of charts representing different test statistics.
Log Analyzer may analyze all types of log files: HTML, Text, and DBF log files.
In a second, administrator can get a snap shot of the host performance over a period of days or even months.
Several examples of the reports:
Example #1
Example #2
Example #3
Features:
- Log Analyzer allows you to check information individually for each test;
- It allows to analyze several log files at once;
- For each test you can view a graphical chart (Quick chart or FullScreen chart)
- The highly flexible Report Manager allows you to create and customize reports to your taste in a variety of ways;
- Scripting support allows you to create reports automatically.
See also: Log Visualizer
Main menu:
| File |
| Load file | - | Loads and analyzes specified log file |
| Append file | - | Appends information from specified log file into the current data set |
| Load ODBC log | - | Loads and analyzes log records from database |
| Append ODBC log | - | Appends information from specified database |
| Setup ODBC logs | - | Brings up ODBC logs Manager dialog |
| Refresh | - | Rereads all loaded log files |
| Print | - | Prints information from an active pane |
| Exit | - | Closes Log Analyzer |
| |
| Search |
| Find | - | Searches for specific text, and highlights the first occurrence |
| Search again | - | Repeats the last search (starts from current position) |
| Filter | - | Date/time filter allows you to analyze log file(s) for specified period of time |
| |
| View |
| Toolbar | - | Shows/hides toolbar |
| Log pane | - | Shows/hides log pane |
| Chart pane | - | Shows/hides chart pane |
| |
| Chart |
| Full screen | - | Displays full screen version of a chart |
| Copy image to Clipboard | - | Copies a chart as an image into the clipboard |
| Print | - | Brings up a Print Preview dialog that allows you to print a chart |
| |
| Reports |
| <list of the reports> | - | Generates HTML report using selected report profile |
| Report Manager | - | Brings up Report Manager dialog allowing you to modify and create new report profiles |
| |
| Options |
| Interface | - | Displays Options dialog with interface related settings |
| Chart | - | Displays Options dialog allowing you to modify settings of the the full screen chart |
| Reports | - | Displays Options dialog with the settings related to the reports |
| |
| Help |
| Help | - | Displays Help |
| Home page | - | Starts default web browser, opens home page of the Log Analyzer on www.ks-soft.net |
| WWW Forum | - | Starts default web browser, opens web forum on www.ks-soft.net |
| Support | - | Allows you to send e-mail to our tech support staff |
| About | - | About Log analyzer |
| License | - | License information and registration options |
Also, each pane provides popup menu that allows you to open full screen chart, copy image to clipboard or print image on your printer.
"Test log" pane on right side of the window provides "Erase line" and "Erase top value" menu items.
"Erase top value" popup menu item allows you to remove (temporarily) log record with top (maximum) reply value for selected test item.
This option is useful when you want to remove one or several records with outstanding results from the chart.
Log Analyzer does not remove records from the file or database, just skips the record from analyzing process.
Similar "Erase line" popup menu item allows you to remove (skip) specific log record (it removes current line).
ODBC logs Manager
Log Analyzer version 5+ may analyze log records which are stored in various databases. Before using such logs you should describe database parameters.
"ODBC logs Manager" dialog (that is available thru menu File -> Setup ODBC logs) allows you to create special profiles where each profile describes one log.
For each log you should specify following parameters:
Name
Name of the profile - log will be available for loading under this name.
E.g. if you named profile as "HMLog-Oracle", you will be able to load such log using script command "LoadTable HMLog-Oracle".
You may use any name but it should be unique.
Data source
Select the data source from drop-down list that displays list of all ODBC data sources installed on your system.
Note: To install or configure Data Source, click Windows Start button, point to Settings, and then click Control Panel.
Double-click Administrative Tools, and then double-click Data Sources (ODBC).
Table name
Provide the name of a table that contains log records
Login/Password
Provide login and password (if required) for database access
Use this source as default
This option allows you to use ODBC log for "Statistics" feature (HostMonitor: menu [Test] -> [Show statistics])
Following fields named in the log table as
This option defines actual fields in the table which contain the information about the test (HostMonitor's ODBC logging could be configured in different ways).
| |
Test name
Specify the name of a field that stores the name of the test.
Test method
Provide the name of a field which stores information about the test method.
Test ID
Specify name of the field that stores test ID.
Normally Log Analyzer collects information considering TestID as test property with high priority (test name can be changed by operator while test ID never changes).
In particular this means you will see single item in the report even if you renamed the test item several times.
Log Analyzer will show latest used test name but collect test statistics using all recorded names.
Also, if you have 2 test items with the same name, Log Analyzer will show 2 items separating statistics using TestID.
Log Analyzer warns you when you "forget" to specify TestID field however it allows you to save and use such profile.
If you setup ODBC log profile without using TestID field, Log Analyzer will process data provided by such log in different way.
It will collect statistics using test name and test method. E.g. report will display several items for single TCP test when port specified for the test was changed or test name was changed.
Date / Time
Provide the name of field(s) that stores information about event date and time. If a single field of the table contains information about date and time, type the same name for both options.
Type of the field could be Date, DateTime, TimeStamp or it can be a text field (which is not recommended).
Status
Provide the name of a field with status information. It could be text field that stores status as a text, e.g. "Host is alive", "No answer", etc.
Or it can be numeric field, where number represents certain status:
00- Not Tested
01- Host is Alive
02- No Answer
03- Unknown
04- Not Resolved |
05- Checking
06- Resolving
07- Ok
08- Bad
09- Disabled |
10- Bad Contents
11- WaitForMaster
12- OutOfSchedule
13- Paused
14- Warning
15- Normal |
Reply
Specify the name of a field that stores Reply value of the test. It could be text or numeric field.
|
Date field is text field
Mark this option if the field which stores date and time of the event is of text type (not datetime or timestamp).
When Date filter is not specified
This option allows you to specify "default" time interval which should be analyzed when Date filter is not specified.
You may choose one of three options:
- analyze all data
- analyze current week
- analyze current month
Please note: this option is available when date&time field(s) of the table is of timestamp or datetime type (not text field).
If the field is of the text type, then an entire table will be analyzed.
Add custom filter
Here you may provide additional filter that will be used in "where" part of the SQL statement.
For example you may use this filter to select information about some specific test item (testname='main router')
Test
Test button executes SQL query and checks the result, showing warning/error messages in case of some problem.
This is useful for validation of your settings.
To manipulate with profiles use 4 buttons located on the upper portion of the dialog window:
| Create new profile |
| Copy selected profile. This is useful if you want to make small modifications for the existing log profile |
| Change name of the profile |
| Remove selected profile |
Once log profile is set, you may analyze data using "Load ODBC log" or "Append ODBC log" items of the File menu.
Also data could be loaded in automatic mode (for details refer to Script section of this manual).
Filter
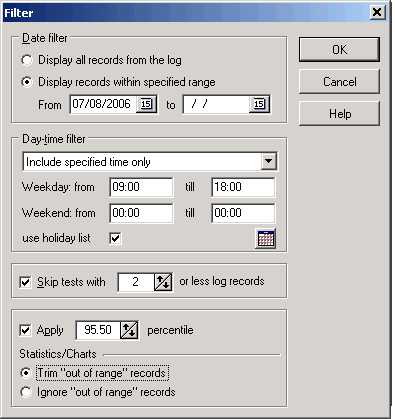
The following options allow you to analyze test results for certain time period.
E.g. Log Analyzer may calculate statistics (alive/dead ratio, average reply, etc) for 2 months period during business hours.
Date filter
This option allows you to specify the date 'window'. Statistics will be calculated for specified days only.
- Display all records from the log
Date filter is disabled, all records from the log file(s) will be displayed and accounted for in the statistical information
- Display records within specified range
Only log records which fall within specified date range will be displayed and considered for statistics. You may provide start date and/or end date.
Day-time filter
In addition to date filter Log Analyzer provides "Day-time" filter. You may choose one of 3 options:
- Display all records (24/7)
Day-time filter is disabled, all records will be displayed and accounted for in the statistical information
- Include specified time only
Only log records which fall within specified time will be displayed and considered for statistics.
You may specify separate time intervals for weekdays and for weekends. If you specify 00:00-23:59 interval, all records will be calculated.
If you specify 00:00-00:00 interval, all records for the day will be ignored.
- Exclude specified time
Exclude log records within specified interval - do not display these records and do not include them in statistics.
You may specify separate time intervals for weekdays and for weekends. If you specify 00:00-23:59 interval, all records for the day will be ignored.
If you specify 00:00-00:00 interval, all records will be calculated.
- Use holiday list
This option tells Log Analyzer to process holidays in the same way it processes weekends (including or excluding some time intervals).
Note: Log Analyzer allows you to check list of holidays however Log Analyzer does not allow you to change this list.
Use HostMonitor or RCC GUI to modify the list (menu Profiles -> Schedules -> Holidays).
If Log Analyzer is installed on different system then you need to copy holidays.lst file from system where HostMonitor is installed.
Skip tests with <N> or less log records
This filter option tells Log Analyzer to exclude from statistics test items with <N> or less records in the log.
These skipped test items will not be included into the reports either.
Percentile
"Apply N percentile" option tells application to ignore or trim out-of-range records. When enabled, this option has effect on "quick" and "full screen" charts, statistics and reports.
For example, if you set "Apply 90 percentile", Log Analyzer will trim (or skip) 10% of records with highest reply numbers.
Application will perform this operation for each test item so highest reply values of "Traffic on hostA" test item will not be mixed with highest reply numbers of "CPU usage on host B" test.
Trim out of range records
Use this option when you want to trim out-of-range values to maximum allowed value.
E.g. if test results are 1, 2, 10, 2, 7, 2, 5, 3, 1, 3 then Log Anlayzer will calculate 90% percentile using the following numbers: 1, 2, 7, 2, 7, 2, 2, 5, 3, 1, 3
Ignore out of range records
Use Ignore parameter when you want to skip all out-of-range records. This option may have effect on alive/dead statistic results as well because some records just ignored.
E.g. if test results are 1, 2, 10, 2, 7, 2, 5, 3, 1, 3 then Log Anlayzer will calculate 90% percentile using the following numbers: 1, 2, 2, 7, 2, 2, 5, 3, 1, 3
Quick Chart
This chart quickly visualizes thousands of log records for selected test item.
You may switch on/off several options:
- Logarithmic mode: this mode can be useful when test results are very close in values; or on the contrary, when results cover a large range of values (you may set this mode using popup menu)
- Average mode: if there are thousands of records in the log for the test, then each point on the chart may represent several log records.
Average mode tells application to calculate and display average test result for each time interval (point).
Otherwise chart will show minimum and maximum value for each time interval. You may set Average chart mode using popup menu
On left mouse click Quick Chart may show log record related to the selected point. If you click on displayed label, Log Analyzer will scroll test related log to this record.
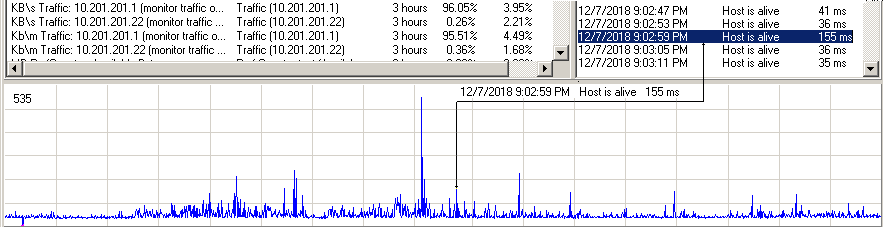
When chart shows thousands of records application helps you to find "points of interest":
- when you just click left mouse button, Quick Chart will try to find nearest point with minimum or maximum test result. Behavior depends on test method, for example:
- Memory tests, Drive Free Space, UNC, VM host free space, VM guest free space, VM host memory, VM guest memory, UPS Charged, UPS Time Remaining tests - Quick Chart will look for local minimum;
- CPU Usage, Temperature tests, Dominant Process, Ping, TCP, URL, HTTP and for many other tests application will look for local maximum;
- for some tests (like Performance Counter, SNMP Get, SNMP Table) Quick Chart will look for nearest local minimum or local maximum
- when you move mouse with button pressed, Quick Chart will show log record related to new selected point, exact point.
However if there are thousands of records in the log for the test, then each point on screen may represent several log records (one point on chart represents some time interval).
In this case application selects log record with minimum or maximum value (depending on test method) related to the point.
If you set "Average" chart mode, then you may see difference between logged test result and the chart - chart will show average value for some time interval while text label will show minimum or maximum result for the same time interval
Full screen chart:
 To display a chart in a full screen window, choose the item "Full screen chart" from the popup menu (this menu appears when you right-click in the Log Analyzer window).
Starting from version 3.50 Log Analyzer allows zooming in and out over the selected area of a chart.
To zoom in on a chart area, hold the left mouse button and drag mouse down and right. You will see a rectangle around the selected area.
Release the left mouse button to zoom in. You may continue zooming again and again.
To restore (undo) the zoom, drag a rectangle in the opposite direction (up and left).
After you right click the chart you may change upper and lower limits of the vertical and horizontal axis using "Set bounds" popup menu item.
In the Chart Bounds dialog use an "Interval to display" parameter to set what time period needs to be displayed on the graph (horizontal axis).
Use "Bounds to display" parameter to set the limits for "Reply" value mapping onto a graph (vertical axis).
| Test logged time (from-till) | - | shows the whole period of time for which records in the log are available |
| Interval to display (from-till) | - | specifies the period of time to display on the screen |
|
| Test "Reply" value (min-max) | - | minimum and maximum values of the "Reply" field in the log file |
| Bounds to display (from-till) | - | specifies the lower and upper limits of the vertical axis. The user may change them to display the "Reply" values with a different scale. |
Charts may display graphs in several modes:
| - | every test probe will be displayed as separate item |
- display average on hourly basis
| - | one bar/point with average reply value will be displayed for each hour when tests were performed |
- display average on daily basis
| - | one bar/point with average reply value will be displayed for each day when tests were performed |
- display average on weekly basis
| - | one bar/point with average reply value will be displayed for each week when tests were performed |
- display average on monthly basis
| - | one bar/point with average reply value will be displayed for each month when tests were performed |
You may choose the display mode from popup menu while you work with GUI. This option is also available in each report profile in the Report Manager dialog.
Note: when a lot of records selected for the test (over 7,000) then chart may automatically switch to "Display average on daily basis" or "Display average on hourly basis" mode depending on selected time interval and number of records.
See also: Threshold for charts in average modes option
There are following commands available in the chart's popup menu:
| Menu item | Description |
| Bar | - | display points (Reply values of the test) as vertical bars |
| Line | - | output all points (Reply values of the test) by drawing a line between them |
| Points | - | displays points (Reply values of the test) as small triangles |
| Line & Points | - | displays points as small triangles and draws a line between them |
| |
| 3D | - | enable/disable 3D effects |
| Statistics | - | show/hide semi-transparent panel with statistical information about the test |
| Logarithmic mode | - | this mode can be useful when test results are very close in values; or on the contrary, when results cover a large range of values |
| |
| Options | - | brings up Options dialog |
| Set bounds | - | brings up Chart Bounds dialog (allows you to set lower and upper limits both for vertical and horizontal axis) |
| Adjust | - | sets the lower and upper limit of a vertical axis so that the "Reply" values of the selected time interval are fit on the screen |
| |
| Copy image to Clipboard | - | copies a chart as an image into the clipboard |
| Save to file | - | saves an image of the chart as a bitmap (BMP) file |
| Print | - | brings up Print Preview dialog |
| |
| Close | - | closes full screen chart (returns to Log Analyzer main window) |
To close the full screen chart and return to Log Analyzer main window, press [ESC] or [Enter] or select "Close" menu item after the right click on the chart.
Report Manager:
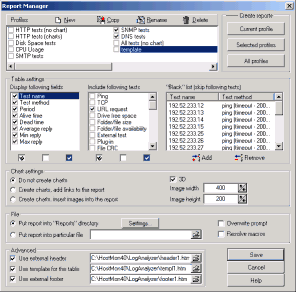 The highly flexible Report Manager allows you to create and customize reports in a variety of ways.
Within each profile you may set the following parameters:
The highly flexible Report Manager allows you to create and customize reports in a variety of ways.
Within each profile you may set the following parameters:
Table settings
Display following fields
The listbox on the left in the Report Manager dialog window contains the list of fields that you may include into the report (e. g., test name, test method, average reply, downtime, etc.).
Click on the check box next to a field name to mark/unmark the item. Use "Mark all" button to select all available fields, use "Unmark all" button to deselect all items, use "Invert selection" to invert selection for the list.
Include following tests (methods)
The list in middle selects the test types to include into the report (e. g., all tests except Ping and CPU Usage tests).
Click on the check box next to a field name to mark/unmark the item. Use "Mark all" button to select all available fields or use "Clear all" button to deselect all items.
"Invert selection" option is also available.
Black list/White list
Use this option when you need to exclude or include some specific tests from/into the report.
E.g. if you have configured report to display HTTP tests and then have added www.yahoo.com and www.google.com HTTP tests into Black list, report will display all HTTP tests except the latter two.
If you use "White list" option instead, tests specified in "white" list will be displayed in the report regardless of "Include following test (methods)" option. For example you may use this option to display all IMAP tests + several specific POP3 tests.
If you want to display only tests that are specified in the "White list", unmark all test methods in the "Include following tests (methods)" option.
Chart settings
Log Analyzer can create chart image for each test that is included in the report. Charts are stored as images in PNG file format.
Choose one of the following options to set chart generating mode:
- Do not create charts
- Create charts, show links in the report
- Create charts, insert images into the report
- Create charts, interactive mode
Display mode
What data should be displayed:
| - | every test probe will be displayed as separate item |
- display average on hourly basis
| - | one bar/point with average reply value will be displayed for each hour when tests were performed |
- display average on daily basis
| - | one bar/point with average reply value will be displayed for each day when tests were performed |
- display average on weekly basis
| - | one bar/point with average reply value will be displayed for each week when tests were performed |
- display average on monthly basis
| - | one bar/point with average reply value will be displayed for each month when tests were performed |
See also: Threshold for charts in average modes option
Chart type
Choose type of the chart:
| - | display points (Reply values of the test) as vertical bars |
| - | output all points (Reply values of the test) by drawing a line between them |
| - | displays points (Reply values of the test) as small triangles |
| - | displays points as small triangles and draws a line between them |
option not applicable for interactive charts
3D
Mark this option if you want to enable 3D effects
Chart width
This parameter specifies width of the chart image (maximum possible width is 6000 pixels).
Chart height
This parameter specifies height of the chart image (maximum possible height is 5000 pixels).
option not applicable for interactive charts
Vertical bounds
The option allows you to specify the lower and upper limits of the vertical axis. You may keep default value (Auto) or set bounds to display the "Reply" values within specified range.
For example you may specify range 0-100 for report that shows CPU Usage test methods.
option not applicable for interactive charts
Interactive mode
This mode allows you to create reports like these sample1, sample2
(click on test item to open/close chart)
There are several advantages over "static" reports with charts:
- much smaller report size (3-10 times smaller, depending on data and chart size)
- much faster generation time
- entire report created as single HTML file, its easy to attach report to e-mail (no hundreds JPG files necessary)
- interactivity - you may open and close charts for specific test items at any time
There are some drawbacks as well:
- run-time interactive chart generation is slow, if you want to check charts for many test items, this will take some time (speed depends on your web browser, e.g. Chrome and Opera works pretty well, while Edge and especially IE is much slower)
- in order to work with interactive charts you need access to internet.
If your system does not have internet access, you may download the following file https://www.ks-soft.net/download/libs/json/set1.zip, unzip 3 files (jquery.min.js, raphael.min.js, morris.min.js) and make them available using your corporate web server;
then you need to modify logsman.ini file - add line like
ExternalScripts=<script src="http://path_to_the_file_on_your_server/jquery.min.js"></script><script
src="http://path_to_the_file_on_your_server/raphael.min.js"></script><script src="http://path_to_the_file_on_your_server/morris.min.js"></script>
into [Reports] section and restart Log Analyzer
File / Header / Footer
File
By default Log Analyzer saves all reports into one directory (you can specify that directory in the Options dialog), and uses the name of the profile as a file name (with HTM extension).
But you can specify another file name by choosing the "Put report into particular file" option and providing a path and name of the file.
Overwrite prompt
With this option enabled Log Analyzer will ask for confirmation if the report file that is going to be created already exists.
Resolve macros
If you enable this option a date macro variables may be specified in the destination file name.
Log Analyzer will interpret text between the '%' in the file name as a macro variable, where 'DD' represents the day of the month, 'MM' - the month, 'YY' - the year (2 last digits), 'YYYY' - the year.
This allows creating file names by a template such as one of these:
C:\HostMonitor4\Reports\%DDMMYY%-rep.htm
C:\HostMonitor4\Reports\%YYYY\DD-MM%.htm
Templates
Use external header
Use external footer
Using these options you can provide an HTML files that will be used as a header and/or footer for the report.
Mark this option only if you want to change the standard header or footer of the report. In HostMonitor's directory "Examples\LAReports\" you can find an example of the header and footer (the files: footer1.htm, header1.htm, header2.htm).
In the header/footer file you can use macro variables to show the current date and time, name of the log file, information about date/time filter, etc.
You may select different colors and so on. Below is a list of the macro variables that may be used in an external header/footer:
| Variable | Description |
| %Date% | Current date |
| %Time% | Current time |
| %DateTime% | Current date & time |
| %BGColor% | Background color |
| %TextColor% | Text color |
| %LinkColor% | Hypertext link color |
| %VLinkColor% | Visited link color |
| %ALinkColor% | Active link color |
| %LogFilePath% | Full path with name of the log file(s) that is analyzed |
| %LogFileName% | Name of the log file(s) that is being analyzed |
| %DateInterval% | Information about date interval that was analyzed. E.g. "01/01/04 - 01/15/04" or "May 2005" (when the date interval covers one full month from the first to last day thereof, the variable will contain only the name of the month and year). |
| %TimeFilter% | Information about time filter in use. E.g. "Included: Weekday [09:00-18:00]", "Excluded: Weekend [00:00-23:59]". When no time filter was applied the value of this variable is "24/7". |
Use template for the table
By using this option you may provide a file with HTML code that will be used to represent each test within the report.
Of course each test has unique parameters so you have to use macro variables (which represent different test parameters) in the template.
For example: if you want to create the report that will display a table with an average reply value for each test, use simple template with 2 variables:
"<tr><td>%TestName%</td><td>%AverageReply%</td></tr>"
(an HTML code for the header of a table should be contained in the header file).
In HostMonitor's directory "Examples\LAReports\" you will find an example of such template (file templ1.htm).
Below is a list of the macro variables that can be used in a template:
| Variable | Description |
| %TestName% | name of the test |
| %TestMethod% | test method |
| %TestID% | unique ID of the test |
| %Period% | represents the whole time interval of the test log |
| %AverageReply% | the average value of the results obtained |
| %MinReply% | the minimum value of the results obtained |
| %MaxReply% | the maximum value of the results obtained |
| %AliveRatio% | Percentage of "Good" test results |
| %DeadRatio% | Percentage of "Bad" test results |
| %UnknownRatio% | Percentage of "Unknown" test results |
| %DetailedLogFile% |
when this variable occurs in the table template, Log Analyzer creates HTML file that contains all check results for the test.
It substitutes this variable with a corresponding file name.
So, if you want to provide detailed log file for each test, use HTML code such as "<a href="%DetailedLogFile%">".
|
| %ImageFile% | when this variable occurs in a template Log Analyzer creates
PNG image that represents the test results and inserts the file name of this image file instead of the variable.
So, if you want to insert images into the report, use HTML code like "<img src="%ImageFile%">".
If you want to insert links to images into the report, use code like "<a href="%ImageFile%">".
|
Several examples of the reports:
Example #1
Example #2
Example #3
Example #4
Create reports
Report Manager dialog contains several buttons that allow you to generate reports right away:
- Current profile: creates report using current profile (the one you are currently editing)
- Selected profiles: creates reports for marked profiles
- All profiles: creates reports for all profiles
Options:
Interface page
Colors
Offers a choice of colors for the text, background and a chart pane.
Show Toolbar
Shows/hides the toolbar
Show Log pane
Shows/hides the log pane
Show Chart
Shows/hides the chart pane
Grid
By using this option you may specify a number of vertical and horizontal lines of the grid in a chart pane.
You may also enable or disable grid in the log pane.
Use fixed date&time format
By default Log Analyzer gets current Windows regional settings at startup and uses these parameters until you change Windows settings and restart application.
You may use this option to define the date & time formats (e.g. DD/MM/YYYY h:mm:ss AMPM).
In this case, Log Analyzer will use the specified formats overriding the system settings.
BTW: Changing the date format does not affects analyzing of the DBF and HTML log files. Log Analyzer is able to analyze these log files correctly regardless of the date & time settings.
However this option can be useful to analyze text log files or html log files that were created by older versions of HostMonitor.
Chart page
You may chose the color scheme for the full screen chart on this page.
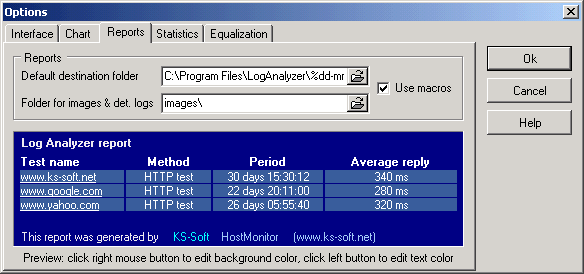
Reports page
Default destination folder
Provide a path to the default destination folder for the reports. If this parameter is empty, Log Analyzer will use the directory where it was started from.
In Report Manager you may specify different destination directory for some of the reports.
Folder for images & detailed logs
Here you may specify a path to a separate folder where auxiliary images and detailed log files will be stored.
If you specify the relative path, Log Analyzer will use "Default destination folder"+"Folder for images" as a destination path.
E.g. if you have defined "C:\HostMonitor4\Reports\" as a default folder and "Images\" as folder for images, then images and detailed logs will be stored in "C:\HostMonitor4\Reports\Images\" directory.
Use macros
If you enable this option a date macro variables may be specified in the path.
Log Analyzer will interpret the text between the '%' of the path string as a macro, where 'DD' represents the day of the month, 'MM' - the month, 'YY' - the year (2 last digits), 'YYYY' - the year.
For example the use of such a template will create a separate folder every day:
C:\HostMonitor4\Reports\%DD-MM-YY%\
C:\HostMonitor4\Reports\%YYYY\DD-MM%\
Color palette
You may customize color scheme for the HTML reports. The following elements have customizable colors (you may change both fore- and background colors):
- underlaying layer;
- table header;
- test items;
- system messages;
- HTML links;
- Visited HTML links;
- Active HTML links;
To change the color of an element, click on an element that you want to change.
Use right-click to change its background color, and left-click to change the text color.
The colors of the chart (GIF images) may be changed on Chart page of the Options dialog.
Statistics page
Alive/Dead ratio
This option specifies how "alive time" versus "dead time" percentage should be calculated.
- 100% time = alive + dead + unknown
Defines the total monitored time (for each test) as the sum of time intervals when the test had "good", "bad" or "unknown" status.
Time intervals during which the test was disabled or was waiting for master test are ignored.
So, "alive" ratio = (alive time) / (alive + dead + unknown time)
- 100% time = alive + dead + unknown + WaitForMaster
Defines the total monitored time (for each test) as the sum of time intervals when the test had "good", "bad", "unknown" or "WaitForMaster" status.
Time intervals during which test was disabled are ignored. So "alive" ratio = (alive time) / (alive + dead + unknown + WaitForMaster time)
- 100% time = alive + dead + unknown + disabled
Defines the total monitored time (for each test) as the sum of time intervals when the test had "good", "bad", "unknown" or "disabled" status.
Time intervals during which test was waiting for master test are ignored. So, "alive" ratio = (alive time) / (alive + dead + unknown + disabled time)
- 100% time = alive + dead + unknown + disabled + WaitForMaster
Defines the total monitored time (for each test) as the sum of time intervals when test had "good", "bad", "unknown", "disabled" or "WaitForMaster" status.
So "alive" ratio = (alive time) / (alive + dead + unknown + disabled + WaitForMaster time)
Threshold for charts in average modes
When "display all data" chart mode is selected, color of each point depends on status of the test at this specific time (e.g. green for passed probes, red for failed).
Behavior of the chart in "average" modes is more complicated - test items may change their status several times during the time interval (day, month...) but the chart displays just the single item.
What color should be used for such points? 2 new options (located on Statistics page in the Options dialog) allow you to specify "bad" and "unknown" thresholds for such items:
- Display "Bad" status when (Bad time)/(Total time) ratio exceeds <N>%
specifies threshold for "bad" statuses in % of time interval.
If the accrued time during which the test had bad status equals or exceeds specified percentage then the item on the chart will be displayed with "bad" color (red by default).
E.g. if you are using "display average on hourly basis" mode and 10% threshold, then if some host did not respond for ping test for 6 or more minutes within an hour, you will see red bar on the chart.
- Display "Unknown" status when Unknown/Total time ratio exceeds <N>%
specifies threshold for "unknown" statuses in % of time interval.
If the accrued time during which the test had unknown status equals or exceeds specified percentage then the item on the chart will be displayed with "unknown" color (yellow by default). E.g. if you are using "display average on daily basis" mode and 25% threshould, then
if some test had "unknown" status for 6 or more hours within a day, you will see yellow bar on the chart.
Please note: "bad" status has higher priority than "unknown" status.
It means if "bad" time reached specified threshold, the point will be displayed in red color regardless of how long this test had "unknown" or "good" status.
Equalization
This parameter allows you to equalize Traffic Monitor test results to the same units.
Choose one of the following options
- Reduction: use Kbit units for all tests
- Reduction: use KB units for all tests
- Reduction: use Mbit units for all tests
- Reduction: use MB units for all tests
- Display values as is
Scripts:
Log Analyzer 4.0+ supports scripts. Scripts allow you to generate reports automatically by schedule (e.g. using standard NT scheduler).
Log Analyzer Script file (default extension .LAS) is a simple text file that contains commands for the application.
You can create and edit script file using any text editor (e.g. notepad).
Some common rules:
- You can put only one command in each line
- Comments: The program ignores all strings with a semicolon (;) as the 1st character
- Commands: commands are case insensitive (e.g. "Load" and "LOAD" means the same)
- When you provide a log file name or a date filter you can use date macro variables.
Log Analyzer will interpret the text between '%' in the parameter as a date macro variable, where 'DD' represents the day of the month, 'MM' - the month, 'YY' - the year (2 last digits), 'YYYY' - the year.
Also you may use special date expressions.
List of the commands:
| Command | Parameter(s) | Description |
| LoadFile | <log file name> | Loads and analyzes specified log file |
| AppendFile | <log file name> | Appends information from specified log file into current data set |
| LoadTable | <name of the ODBC log source> | Loads and analyzes log records from database (see ODBC logs Manager dialog for details) |
| AppendTable | <name of the ODBC log source> | Appends information from specified database (see ODBC logs Manager dialog for details) |
| DateFilter | <start date> <end date> | Applies filter that determines what time period Log Analyzer should include into the reports.
Format of the <start date> & <end date> is: DDMMYYYY |
| TimeFilter Include | <time interval (weekdays)>
<time interval (weekends)>
[UseHolidayList] |
Only log records within specified time will be considered for statistics. You should specify separate time intervals for weekdays and for weekends.
If you specify 00:00 23:59 interval, all records will be accounted.
If you specify 00:00 00:00 interval, all records for the day will be ignored.
Format of each time interval is HH:MM hh:mm, where HH:MM - hour and min of the beginning of the inteval, hh:mm - hour and min of the end of the interval.
E.g. TimeFilter Include 09:00 18:00 00:00 00:00
Please note: the most resent TimeFilter command overrides any and all previous TimeFilter commands. |
| TimeFilter Exclude | <time interval (weekdays)>
<time interval (weekends)>
[UseHolidayList] |
Exclude log records within specified interval - Log Analyzer will not display these records; will not include them into statistics for specified time.
You should specify separate time intervals for weekdays and for weekends.
If you specify 00:00-23:59 interval, all records for the day will be ignored. If you specify 00:00-00:00 interval, all records will be calculated.
Format of each time interval is HH:MM hh:mm, where HH:MM - hour and min of the beginning of the inteval, hh:mm - hour and min of the end of the interval.
E.g. TimeFilter Exclude 09:00 18:00 00:00 23:59
Please note: the most resent TimeFilter Exclude command overrides any and all previous TimeFilter Exclude commands. |
| TimeFilter 24/7 | | Disables "Day-time" filter. All log records will be displayed and calculated for statistical information |
| SkipMode On | | Tells Log Analyzer not to display test items with <N> or less records in the log. By default <N> is set to 0, unless you specify different number using SkipLevel command. |
| SkipLevel | <min number of records> | Do not display statistics for test items with <N> or less records in the log. |
| SkipMode Off | | Display all test items. Even for tests that after "day-time" filtering have less records then is specified by SkipLevel command. |
| Percentile | Trim|Ignore
<percentile_number> |
Sets percentile options and value. Use Trim parameter when you want to trim out-of-range values to maximum allowed value.
Use Ignore parameter when you want to skip all out-of-range records (this option may have effect on alive/dead statistic results as well).
Set percentile to 100 when you want to calculate test results as is, without "percentile" processing (this is default mode for Log Analyzer)
Examples:
Percentile Trim 90
Percentile Ignore 89.9
Percentile Trim 100
|
| CreateReport | "<report profile name>" | Creates report using specified report profile |
| CreateSelectedReports | | Creates reports for marked profiles (those that are marked in the Report Manager dialog) |
| CreateAllReports | | Creates reports for all profiles |
Example of the script:
;load log files, set date filter
LoadFile C:\HostMonitor4\logs\%YYYY%\log.htm
AppendFile C:\HostMonitor4\logs\privatelog1.htm
AppendFile C:\HostMonitor4\logs\privatelog2.htm
DateFilter %01MMYYYY% %30MMYYYY%
;only log records that were created between 9am and 6pm on weekday will be used for the report
TimeFilter Include 09:00 18:00 00:00 00:00 UseHolidayList
SkipMode On
SkipLevel 2
CreateReport "HTTP tests (no charts)"
;now skip log records that were created between 6pm and 9pm on weekday
;and skip records that were added at any time on weekend.
;change skiplevel and generate another report
DateFilter %DDMMYYYY[-7d]% %DDMMYYYY[-1d]%
TimeFilter Exclude 18:00 21:00 00:00 23:59
SkipLevel 4
CreateReport "HTTP tests (charts)"
;disable "day-time" filter
TimeFilter 24/7
SkipMode Off
Percentile Trim 95.5
Createreport "Template1"
|
To execute a script, you should start Log Analyzer with the following command line parameter "-script:<name of script file>".
There is also an optional parameter "-log:<name of the log file>".
With this optional parameter Log Analyzer will record information about script execution and about errors in the script (if any) into the specified file.
Example: LogsMan.exe -script:reports.las -log:scriptlog.txt
Optional command line parameters
2GB file analyzing can take several minutes (time depends on file format, number of test items, system performance, etc).
There are some options that may save your time
- onetest command line parameter tells Log Analyzer to find and analyze one or several tests and ignore other test items.
You may specify test ID, list of test IDs, full name of the test or text with wildcard (wildcard should be located at the beginning or at the end).
Examples
| Logsman -logfile:log.txt -onetest:105 | Analyze records related to test with ID 105 |
| Logsman -logfile:log.txt -onetest:105,106,107 | Analyze tests with ID 105, 106 and 107 |
| Logsman -logfile:log.txt "-onetest:Ping 10.10.1.5" | Analyze test named Ping 10.10.1.5 |
| Logsman -logfile:log.txt "-onetest:Cisco*" | Analyze test items with "Cisco" string in test name or test method |
| Logsman -logfile:log.txt "-onetest:*temperature" | Analyze test items with "temperature" string in test name or test method |
When you are using HostMonitor or RCC GUI to analyze log file for specific test, HostMonitor (RCC) checks log file size and applies "onetest" switch for large files, this way Log Analyzer will load log file much faster.
You may adjust limit for such "large" files using MinLogSizeForSingleTest parameter in [Misc] section of hostmon.ini (or rcc.ini) file. For example
[Misc]
MinLogSizeForSingleTest=100
sets 100 MB limit. If you set 0, then "onetest" switch will not be used.
- When Log Analyzer started without "onetest" switch and its not started in scripting mode then application checks number of records in the file.
If there are over 2,000,000 records, it asks "would you like to load last 500,000 records?" so you may choose: load and analyze recent log records or read entire log file. You may adjust these limits using logsman.ini file. For example
[LogAnalizer]
MaxRecordsWarn=8880000
LastRecordsCnt=444000
Minimum system requirements
- Windows XP SP2, Windows 7, 8, 10 or Windows 11
- Windows Server 2003 SP2, Server 2008 SP2/R2, Windows Server 2012, 2016, 2019, 2022
- Internet Explorer 6 (application can work without IE but help system will not be available)
- 3 MB of free disk space
- Minimum screen resolution: 800 x 600
How much does it cost?
When you purchase an Advanced Host Monitor Professional, Advanced or Enterprise edition you will get the license for Log Analyzer at no cost. Otherwise the license costs $45.
You can order Log Analyzer using credit card, Switch and Solo debit cards, check/money order or wire transfer.
Details..
|